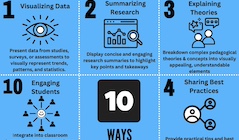
Using Infographics to Go Public with SoTL
DOI:
https://doi.org/10.20343/teachlearninqu.12.10Keywords:
SoTL, best practices, knowledge sharing, public engagement, infographicsAbstract
There has been a call to amplify the scholarship of teaching and learning (SoTL) and expand its reach by engaging with audiences outside the academy. In this paper, we share our journey in crossing disciplinary boundaries and creating a SoTL-informed infographic for public consumption. As the field of SoTL continues to evolve, infographics hold tremendous potential to communicate SoTL to various stakeholders, including educators, students, administrators, policymakers, and the public. We outline best practices in infographic development and the potential of infographics as a tool for taking SoTL public, emphasizing their visual appeal and effectiveness in conveying complex information. We conclude by discussing the implications of using infographics to advance SoTL communication. The efforts of our group serve as a valuable example of how infographics can be used to bring SoTL knowledge out of academia and into the public domain.
References
Barlow, Brooke, Andrew Webb, and Ashley Barlow. 2021. “Maximizing the Visual Translation of Medical Information: A Narrative Review of the Role of Infographics in Clinical Pharmacy Practice, Education, and Research.” Journal of American College of Clinical Pharmacy 4: 257–66. https://doi.org/10.1002/jac5.1386. DOI: https://doi.org/10.1002/jac5.1386
Cavazos, Jenel, Chistopher Hakala, Wendy Schiff, Jennifer White, and Hannah Baskin. 2022. “Flexible Teaching During a Pandemic and Beyond: A Reflection on Lessons Learned From the Society for the Teaching of Psychology’s Pivot Teaching Committee.” Scholarship of Teaching and Learning in Psychology. https://doi.org/10.1037/stl0000342. DOI: https://doi.org/10.1037/stl0000342
Chick, Nancy, and Jennifer Friberg. 2022. Going Public Reconsidered: Engaging With the World Beyond Academe Through the Scholarship of Teaching and Learning. Herndon, VA: Stylus. DOI: https://doi.org/10.4324/9781003445036-1
Claes, Sandy, and Andrew Vande Moere. 2013. “Street Infographics: Raising Awareness of Local Issues Through a Situated Urban Visualization.” In Proceedings of the 2nd ACM International Symposium on Pervasive Displays (PerDis ‘13). Association for Computing Machinery. New York: 133–38. https://doi.org/10.1145/2491568.2491597. DOI: https://doi.org/10.1145/2491568.2491597
Felten, Peter. 2013. Principles of Good Practice in SoTL. Teaching & Learning Inquiry 1 (1): 121–25. https://doi.org/10.2979/teachlearninqu.1.1.121. DOI: https://doi.org/10.20343/teachlearninqu.1.1.121
Friberg, Jennifer, and Nancy Chick. 2022. “A Framework for Public SoTL.” In Going Public Reconsidered: Engaging with the World Beyond Academe Through the Scholarship of Teaching and Learning, edited by Chick and Friberg, 1–14. Virginia: Stylus. DOI: https://doi.org/10.4324/9781003445036-fm1
Ferreira, Giovanni E., Mark R. Elkins, Caitlin Jones, Mary O’Keeffe, Aidan G. Cashin, Rosa E. Becerra, Andrew R. Gamble, and Joshua R. Zadro. 2022. “Reporting Characteristics of Journal Infographics: A Cross-Sectional Study.” BMC Medical Education 22 (1): 1–7. https://doi.org/10.1186/s12909-022-03404-9. DOI: https://doi.org/10.1186/s12909-022-03404-9
Kaur, Angel. 2021. “‘Dope Syllabus’: Student Impressions of an Infographic-Style Visual Syllabus.” International Journal for the Scholarship of Teaching & Learning 15 (2): 1–16. https://doi.org/10.20429/ijsotl.2021.150206. DOI: https://doi.org/10.20429/ijsotl.2021.150206
McCrorie, Allan, Christopher Donnelly, and Kieran McGlade. 2016. “Infographics: Healthcare Communication for the Digital Age.” Ulster Medical Journal 85 (2): 71–5.
Muir, Irene, and Krista Munroe-Chandler. 2020. “Using Infographics to Promote Athletes’ Mental Health: Recommendations for Sport Psychology Consultants.” Journal of Sport Psychology in Action 11 (3): 143–64. https://doi.org/10.1080/21520704.2020.1738607. DOI: https://doi.org/10.1080/21520704.2020.1738607
Murray-Johnson, Kayon, Andrea Munro, and Racheal Popoola. 2021. “Immersive Deep Learning Activities Online.” New Directions for Adult & Continuing Education (169): 35–49. https://doi.org/10.1002/ace.20412. DOI: https://doi.org/10.1002/ace.20412
Monroe, K. James, and Valerie Morrison. 2022. “Creating Accessible Infographics: Describing Scientific Data in Ways Everyone Can Understand.” Assistive Technology Outcomes & Benefits 16 (2): 56–73. https://www.proquest.com/scholarly- journals/creating-accessible-infographics-describing/docview/2712291822/se- 2.
NeoMam Studio. n.d. “Why your Brain Craves Infographics.” https://neomam.com/interactive/13reasons/.
Otten, Jennifer, Karen Cheng, and Adam Drewnowski. 2015. “Infographics and Public Policy: Using Data Visualization To Convey Complex Information.” Health Affairs 34 (11): 1901–907. https://www.healthaffairs.org/doi/full/10.1377/hlthaff.2015.0642. DOI: https://doi.org/10.1377/hlthaff.2015.0642
Piil, Karin, Pia Pedersen, Helle Holm Gyldenvang, Anne-Marie Juhl Elsborg, Anna Bascuñan Skaarup, M. Starklint, Tine Kjølsen, and Helle Pappot. 2023. “The Development of Medical Infographics to Raise Symptom Awareness and Promote Communication to Patients With Cancer: A Co-Creation Study.” PEC Innovation 2. https://doi.org/10.1016/j.pecinn.2023.100146. DOI: https://doi.org/10.1016/j.pecinn.2023.100146
Scott, Hilary, Samantha Fawkner, and Chris Oliver. 2016. “Why Healthcare Professionals Should Know a Little About Infographics.” British Journal of Sports Medicine 50: 1104–105. http://dx.doi.org/10.1136/bjsports-2016-096133. DOI: https://doi.org/10.1136/bjsports-2016-096133
Smiciklas, Mark. 2012. “The Power of Infographics: Using Pictures to Communicate and Connect With Your Audiences.” Indianapolis, IN: Que.
Siricharoen, Waralack, and Nattanun Siricharoen. 2018. “Infographic Utility in Accelerating Better Health Communication.” Mobile Network. 23 (1): 57–67. https://link.springer.com/article/10.1007/s11036-017-0900-3. DOI: https://doi.org/10.1007/s11036-017-0900-3
Spicer, Jennifer, and Caroline Coleman. 2022. “Creating Effective Infographics and Visual Abstracts to Disseminate Research and Facilitate Medical Education on Social Media.” Clinical Infectious Diseases 74 (3): e14–e22. https://doi.org/10.1093/cid/ciac058. DOI: https://doi.org/10.1093/cid/ciac058
Stonbraker, Samantha, Mina Halpern, Suzanne Bakken, and Rebecca Schnall. 2019. “Developing Infographics to Facilitate HIV-Related Patient–Provider Communication in a Limited-Resource Setting.” Applied Clinical Informatics 10 (4): 597–609. https://doi.org/10.1055/s-0039-1694001. DOI: https://doi.org/10.1055/s-0039-1694001
Terabe, Shintaro, Kengo Tannoa, Hideki Yaginumaa, and Nan Kang. 2019. “The Impact of Flyer with Infographics on Public Awareness and Interest to Transportation Project.” Transportation Research Procedia 48 (2020); 2378–84. https://doi.org/ 10.1016/j.trpro.2020.08.282. DOI: https://doi.org/10.1016/j.trpro.2020.08.282
VanderMolen, Julia, and Christy Spivey. 2017. “Creating Infographics to Enhance Student Engagement and Communication in Health Economics.” The Journal of Economic Education 48 (3): 198–205. https://doi.org/10.1080/00220485.2017.1320605. DOI: https://doi.org/10.1080/00220485.2017.1320605

Downloads
Published
Issue
Section
License
Copyright (c) 2024 Bryn Keogh, Lorelli Nowell, Eleftheria Laios, Lisa McKendrick-Calder, Whitney Lucas Molitor, Kerry Wilbur

This work is licensed under a Creative Commons Attribution-NonCommercial 4.0 International License.


