Excess mortality in England and Scotland in 2022: The long shadow of austerity and the return to an unacceptable pre-pandemic baseline
Research Article
Daniel R. R. Bradford1*, Denise Brown1, Gerry McCartney2, Margaret Douglas3,4, Ruth Dundas1 and David Walsh4
1MRC/CSO Social and Public Health Science, University of Glasgow, Glasgow, UK 2School of Social & Political Sciences, University of Glasgow, Glasgow, UK 3Public Health Scotland, UK 4School of Health & Wellbeing, University of Glasgow, Glasgow, UK *Corresponding author: Daniel R. R. Bradford, d.bradford.1@research.gla.ac.ukConcerns exist that mortality remains elevated after COVID-19 peaks. This study examined whether mortality in England and Scotland in 2022 exceeded predictions from austerity-era (2012–2019) and pre-austerity (2001–2010) trends. Time trend analysis was conducted using data from 2001–2022. The outcomes were observed and expected age- and sex-standardised mortality rates (ASMRs). Expected 2022 ASMRs were calculated from austerity-era and pre-austerity trends. Excess deaths were estimated by comparing observed and expected ASMRs. Observed ASMRs were higher than austerity-era predictions and substantially higher than pre-austerity predictions. In England, excesses for females were 4.4% (4.0–4.8) and 38.2% (95% CI: 37.7–38.7), and 7.2% (6.8–7.6) and 57.0% (56.4–57.6) for males. In Scotland, excesses for females were 3.4% (2.2–4.5) and 26.6% (25.2–28.0), and 2.6% (1.5–3.8) and 45.2% (43.6–46.9) for males. COVID-19 accounted for 5.3–6.5% of deaths in 2022 and explained much of the excess compared to austerity-era trends. ASMRs were 1.68–1.94 times higher in the most versus least deprived areas. Deaths attributable to COVID-19 explain much of the excess compared to austerity-era trends. However, 879,430 excess deaths relative to pre-austerity trends, even excluding COVID-19 deaths, highlights the devastating impacts of austerity on public health.
Introduction
There are concerns that UK mortality rates remained elevated after the COVID-19 peaks in 2020 and 2021 compared to the preceding years (Mostert et al. 2024, National Records of Scotland 2023, Office for National Statistics 2023a, Raleigh 2022). Before considering potential causes of continuing increased mortality, it is essential to determine whether an excess exists. Whether a rate is deemed excessive depends on the definition of the expected counterfactual rate. In defining the counterfactual, both temporal trends in mortality before the pandemic and changes in the population’s age and sex structure must be considered. Prior studies have not always done so. For example, the Organisation for Economic Co-operation and Development (OECD) and the Office for National Statistics (ONS) used mean crude death counts from the five years before the pandemic as a baseline for estimating excess deaths (OECD 2023, Office for National Statistics 2023a). The recently updated ONS methodology relies on only the most recent five years of data, and therefore cannot account for the major shift in mortality trends that began around 2012 in the UK (Fenton et al. 2019a, Walsh, Dundas et al. 2022, Office for National Statistics 2024a, De Haro Moro et al. 2025). The purpose of this study was to compare mortality in England and Scotland in 2022 with expected rates extrapolated from longer-term pre-pandemic trends in age- and sex-standardised mortality rates (ASMRs).
Any examination of recent mortality trends must consider the changes observed in the UK from around 2012 onwards (Public Health England 2018, Fenton et al. 2019a, Minton et al. 2020, McCartney et al. 2022, Walsh, Dundas et al. 2022). Around this time, national mortality rates stopped declining, reversing over a century of improvement except during the World Wars and the 1918 influenza pandemic (Fenton et al. 2019b, Office for National Statistics 2022, Public Health England 2018). These altered trends have been seen across nearly all age groups and causes of death, and for both sexes (Bennett et al. 2018, Ramsay et al. 2020). However, the impact has not been uniform: mortality rates in the most socioeconomically disadvantaged areas have increased, and inequalities between the most and least disadvantaged areas have widened (Walsh, Dundas et al. 2022). The scale of these latter changes has differed by both sex (Bennett et al. 2018, Walsh, Dundas et al. 2022) and age (Loopstra et al. 2016, Walsh et al. 2020). This study examines mortality trend changes at the population level by sex as well as for selected combinations of sex, area deprivation, and age groups to characterise how these changes are distributed across society.
There is now an overwhelming body of evidence attributing these unprecedented changes in mortality to the imposition of ‘austerity’ by the UK Government from 2010 onwards (Martin et al. 2021, McCartney, McMaster et al. 2022, Prędkiewicz et al. 2022, Seaman et al. 2024, Walsh & McCartney 2024). Austerity has been implemented through enormous public spending cuts, particularly affecting poorer populations via reductions in social security and the defunding of vital public services. Consequently, using trends in ASMRs in the years immediately prior to the pandemic to predict expected counterfactual ASMRs in 2022 (as is the case in ONS publications) is based on a faulty assumption i.e., that trends in the period just before the pandemic were ‘normal’ and were simply a continuation of the previous trajectory. This assumption obscures the true scale of excess mortality observed since austerity was introduced. This study therefore estimated expected counterfactual ASMRs in 2022 predicted by trends observed both before and after the imposition of austerity.
Several hypotheses have been proposed to explain persistently high mortality following the COVID-19 peaks in high-income countries, as summarised in a recent scoping review (Scott et al. 2024). One hypothesis is that the excesses are caused by direct COVID-19 deaths. This study therefore also considered the contribution of direct COVID-19 deaths in England and Scotland in 2022.
The research questions addressed were:
- How did observed ASMRs in England and Scotland in 2022 compare to expected ASMRs predicted by a continuation of austerity-era trends (2012-2019)?
- How did observed ASMRs in England and Scotland in 2022 compare to expected ASMRs predicted by a continuation of pre-austerity trends (2001-2010)?
- Were differences in observed and expected ASMRs based on the two prediction periods consistent across subgroups of age, sex, and area deprivation?
- What proportion of deaths in England and Scotland in 2022 were attributable to COVID-19?
Methods
This study followed REporting of studies Conducted using Observational Routinely-collected Data (RECORD) guidelines (see Appendix I for checklist; Benchimol et al. 2015).
Population
We focus on the total populations of England and Scotland. England and Scotland are two of the four ‘nations’ that make up the UK (Wales and Northern Ireland being the other two). Together, England and Scotland constitute 93% of the population of the UK (Office for National Statistics, n.d.). The Scottish, Welsh and Northern Irish parliaments and assemblies have varying levels of devolved legislative powers. Scotland has tended to make the most extensive use of devolved powers to pursue mitigating policies where feasible, partly offsetting UK-wide measures. However, austerity policies have been implemented UK-wide by the UK Westminster Government, as it has power over most social security legislation, as well as control of overall spending. Thus, the effects of austerity on mortality have been observed in all four nations (De Haro Moro et al. 2025, Walsh & McCartney 2024) but here we focus on England and Scotland principally for reasons of data availability.
Data
Mortality
Annual mortality data for England and Scotland for 2001-2022 were obtained from the Office for National Statistics and National Records of Scotland (Office for National Statistics 2023b). Scottish data included cause of death, while English data provided only counts of deaths mentioning COVID-19 without details on other causes (Office for National Statistics 2024b). In this study, a COVID-19 death was defined for both nations as any death where COVID-19 was mentioned on the death certificate, not necessarily as the underlying cause.
Population
Population data for England and Scotland for 2001–2022 were obtained from the Office for National Statistics and National Records of Scotland (Office for National Statistics 2023b). For most years, data were disaggregated by five-year age group, sex, and deprivation level. However, the national statistical agencies had not published population data by deprivation level for 2021–2022 in England, and for 2022 in Scotland. Data for these years were only available by age and sex, with an unknown distribution by deprivation. To estimate counts for each age–sex–deprivation group in the missing years, we assumed that the relative distribution of the observed total population across the deprivation levels within each age–sex group remained unchanged from the most recent published data (2020 for England and 2021 for Scotland) and applied these proportions to the available age–sex data (i.e., the total national population data for all years and all nations are observed values, only the relative distribution of the population across deprivation groups was assumed for 2021–2022 in England and 2022 in Scotland; all mortality data are observed, including the distribution by deprivation).
Deprivation
Deprivation was measured using national indices: the Index of Multiple Deprivation (IMD) for England and the Scottish Index of Multiple Deprivation (SIMD). These indices use indicators of deprivation grouped into seven domains: income, employment, health, education, housing, living environment/geographic access to local facilities, and crime. A deprivation score is calculated as a weighted combination of scores in these domains. Although derived separately using slightly different indicators and spatial scales, the two measures have been shown to be comparable (Walsh et al. 2020). Standardised mortality rates are included in both the English and Scottish overall IMD, but previous work has shown the effect of this circularity to be negligible (Bradford et al. 2023, McCartney et al. 2023a). Deprivation was measured at the small-area level using geographic units with populations of around 1,000. Areas were ranked by composite deprivation scores and grouped into five categories from most to least deprived. Each group contained approximately 20% of the national population. Small deviations from exactly 20% arose because deprivation groups are constructed from whole geographic units, which cannot always be divided perfectly equally. The most deprived category represents the 20% of population experiencing the greatest overall disadvantage across the seven deprivation domains. As both the IMD and SIMD are periodically updated, mortality data were linked to the chronologically-nearest version (see Tables A1a and A1b in Appendix II).
Analysis
ASMRs and 95% confidence intervals were calculated using the phe_dsr function from the PHEindicatormethods package v2.0.2 in R v4.2.0 (Georgina 2020, R Core Team 2022). This function calculates ASMRs directly standardised to the 2013 European Standard Population (ESP2013). The upper age group comprised individuals aged 85 or older. In addition to all-age rates, ASMRs were computed for subgroups—premature mortality (0–74 years), older adults (>74 years), older working age (45–64 years), and younger working age (20–44 years). Note that the ‘working age’ groups included all people in these age groups, regardless of employment status. These age groups were selected to characterise how changes in ASMRs have affected different parts of society. ASMRs were calculated by nation and sex, with additional stratification by deprivation and age group. Rate ratios were calculated as the ratio of ASMRs between deprivation groups to measure relative inequalities reference against the least deprived group.
Counterfactual Estimation
Expected ASMRs were calculated from two baseline counterfactuals based on extended pre-pandemic trends in the pre-austerity (2001–2010) and austerity (2012–2019) periods, rather than relying on the most recent five years of data as in ONS reports. Data were plotted to check for linearity, and linear regression models were extrapolated to 2022 with year as the independent variable and ASMRs as the dependent variable. Independent linear regression models were fitted for each combination of nation, sex, age, and area deprivation to generate expected ASMRs. Confidence intervals were not calculated for expected ASMRs as the number of datapoints used in each model did not meet normality assumptions, though trends are clearly linear (see the period 1981—2010 in Figure 1). The start of 2001 was chosen to provide a similar number of data years for both periods and because mortality data disaggregated by deprivation level were available from that year. The terminal year of 2010 was selected to coincide with the imposition of austerity, and 2012 was chosen based on inflection points in trends observed in 2011–2013 (Walsh, Dundas et al. 2022). A sensitivity analysis was conducted using start years of 2011, 2012, and 2013, while 2019 was chosen to omit peak COVID-19 mortality.
Excess Mortality
Excess mortality was defined as observed ASMR exceeding the expected ASMR. Relative excess mortality was expressed as a percentage relative to the expected ASMR for each combination of nation, sex, age subgroup, area deprivation and year. This was calculated as 100*((observed ASMR – expected ASMR)/expected ASMR). Confidence intervals for observed ASMRs were calculated using Dobson’s method (Dobson et al. 1991). Expected death counts were computed by multiplying ASMRs by the relevant population and adjusting for age structure differences relative to the ESP2013. The correction factor was determined by dividing observed deaths by the product of the observed ASMR and the relevant population (see Table A4 in the Appendix II for further details and numerical examples). This factor was calculated for each combination of nation, sex, five-year age group, area deprivation, and year. Excess deaths were estimated by subtracting expected counts from observed counts.
Findings
In 2022, relative excess ASMRs were 5.6% in England and 2.9% in Scotland compared to predictions from austerity-era trends (2012–2019), and 44.5% and 33.1% respectively compared to pre-austerity trends (2001–2010). Figure 1 shows ASMRs from 2001–2022, summarising 21,431,282 deaths in England and 2,475,589 in Scotland. Table 1 presents the related ASMRs for 2022. Across both nations and all age subgroups, males had higher ASMRs. Excesses were observed in most age subgroups except younger working age adults in Scotland (see Figures A1a–A1d in Appendix II). Males in the older working (45–64 years) and older adult (>74 years) groups experienced the highest relative excess mortality compared to both baseline trends.
Inequalities
Excess mortality in 2022 relative to both counterfactual baselines was observed across all deprivation groups. However, ASMRs increased with deprivation in both nations and sexes. ASMRs were consistently highest in the most deprived areas. ASMRs for the most and least deprived fifths from 2001–2022 are shown in Figure 2 and Tables 2a and 2b (see Figure A2 and Tables A2a and A2b in Appendix II for all deprivation groups). Increasing rate ratios between 2010 and 2022 demonstrate a widening of inequalities for both nations and sexes. In England in 2022, ASMRs in the most deprived areas were 1.68 times higher than the least deprived for females (up from 1.53 in 2010); the equivalent rate ratios were 1.75 (1.65 in 2010) for males in England, 1.80 (1.66 in 2010) for females in Scotland, and 1.94 (1.85 in 2010) for males in Scotland.
When excess mortality was calculated relative to expected ASMRs based on austerity-era trends (2012–2019), the least deprived areas had slightly larger absolute excesses than the most deprived areas in 2022. In contrast, excesses defined relative to expected ASMRs based on pre-austerity trends (2001-2010) were substantially larger across all deprivation groups and increased with deprivation. It is important to recognise that differences in austerity-era trends by deprivation influenced the expected ASMRs used to calculate both absolute and relative excesses. In the least deprived areas, ASMRs were lower at the onset of austerity and continued to decline during the austerity period. This resulted in lower expected ASMRs in 2022, and larger relative excesses compared to the least deprived areas. In the most deprived areas, ASMRs were already high at the onset of austerity and subsequently stagnated or increased during the austerity period. This resulted in higher expected ASMRs in 2022, and smaller relative excesses despite substantially higher observed mortality rates in this deprivation group.
The Impact of Excluding Direct COVID-19 Deaths
COVID-19 was recorded on 5.7% of death certificates in England and 6.2% in Scotland in 2022. Excluding these deaths, relative excess ASMRs in England dropped from 5.6% to -0.5% and in Scotland from 2.9% to -3.5% based on austerity-era trends. These values are presented in Table 3. Across age subgroups in England, the largest remaining excess after excluding COVID-19 deaths was in the premature mortality age subgroup (0-74 years; 2.5% for females and 4.3% for males) while all Scottish age subgroups showed mortality deficits.
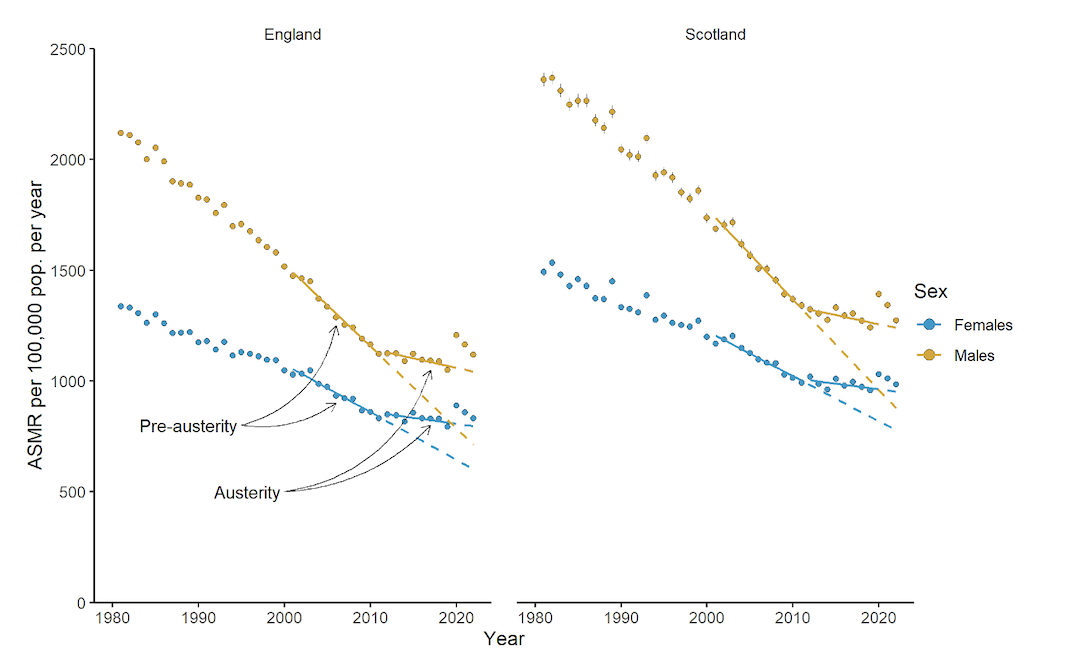
Figure 1: Age-standardised all-cause mortality rates from 1981–2022 in England and Scotland.
Notes: Points are observed rates. Confidence intervals are included for observed rates but are so narrow as to be obscured by the points in most cases. For both nations, solid lines are trends fitted through 2001–2010 (pre-austerity) and 2012–2019 (austerity). Dashed lines are trends from each of the fitted period extrapolated to 2022.
Sensitivity Analyses
Linear regression models were fitted for 60 combinations of nation, sex, age, and area deprivation level. For each, three models were run, varying the start year (2011, 2012, or 2013). Expected ASMRs using 2011 or 2013 varied from -3.2% to +5.7% relative to those based on 2012. Most expected ASMRs differed by less than 1% from the 2012 results. Figure A6 in Appendix II shows the distribution of these differences.
Estimates of Excess Deaths
In England in 2022, there were 11,290 additional female and 18,450 additional male deaths compared to expected deaths based on continuation of austerity-era trends; excluding COVID-19 deaths changed these values to 2,970 fewer deaths for females and 1,640 additional deaths for males. In Scotland, 1,020 additional female and 790 additional male deaths occurred, falling to -850 for females and -1,210 for males after excluding COVID-19 deaths.
Using pre-austerity trends (and after excluding COVID-19 deaths), England recorded 59,490 additional female and 82,480 additional male deaths in 2022, while Scotland recorded 4,670 additional female and 7,540 additional male deaths. Summing excess deaths from 2013-2022 yields 352,580 excess female and 451,700 excess male deaths in England (804,280 total) and 28,790 excess female and 46,360 excess male deaths in Scotland (75,150 total), amounting to 879,430 across both nations. Annual breakdowns are presented in Tables A4a–A4d. Excess deaths occurred across all deprivation levels (see Figures A5a and A5b in Appendix II).
|
Nation
|
Sex |
Age group (years) |
Obs. rate |
Exp. rate 2012-19 |
Excess % 2012-19 |
Exp. rate 2001-10 |
Excess % 2001-10 |
|
England |
Persons |
All |
961 |
911 |
5.6 |
665 |
44.5 |
|
England |
Females |
All |
831 |
796 |
4.4 |
602 |
38.2 |
|
England |
Males |
All |
1118 |
1042 |
7.2 |
712 |
57 |
|
England |
Females |
0-74 |
269 |
251 |
7.1 |
183 |
47 |
|
England |
Males |
0-74 |
420 |
386 |
8.8 |
251 |
67.4 |
|
England |
Females |
>74 |
2131 |
1999 |
6.6 |
1432 |
48.8 |
|
England |
Males |
>74 |
3082 |
2867 |
7.5 |
1736 |
77.6 |
|
England |
Females |
45-64 |
344 |
325 |
6.0 |
260 |
32.5 |
|
England |
Males |
45-64 |
537 |
500 |
7.4 |
360 |
49.2 |
|
England |
Females |
25-44 |
56 |
55 |
3.2 |
46 |
23.6 |
|
England |
Males |
25-44 |
103 |
98 |
4.6 |
86 |
19.9 |
|
Scotland |
Persons |
All |
1116 |
1084 |
2.9 |
839 |
33.1 |
|
Scotland |
Females |
All |
985 |
953 |
3.4 |
778 |
26.6 |
|
Scotland |
Males |
All |
1273 |
1240 |
2.6 |
877 |
45.2 |
|
Scotland |
Females |
0-74 |
347 |
337 |
3.1 |
264 |
31.4 |
|
Scotland |
Males |
0-74 |
514 |
503 |
2.2 |
318 |
61.7 |
|
Scotland |
Females |
>74 |
2628 |
2510 |
4.7 |
2115 |
24.2 |
|
Scotland |
Males |
>74 |
3648 |
3496 |
4.4 |
2440 |
49.5 |
|
Scotland |
Females |
45-64 |
446 |
439 |
1.5 |
332 |
34.4 |
|
Scotland |
Males |
45-64 |
676 |
665 |
1.6 |
390 |
73.4 |
|
Scotland |
Females |
25-44 |
82 |
97 |
-15.6 |
82 |
-0.6 |
|
Scotland |
Males |
25-44 |
147 |
181 |
-18.6 |
149 |
-1.3 |
Table 1: Age-standardised all-cause mortality rates per 100,000 population per year by nation, sex, and age subgroup in 2022.
Notes: Obs. rate is the observed ASMR. Exp. rate, 2012-19 and Exp. rate, 2001-10 are the expected ASMRs if linear trends from the periods 2012-2019 and 2001-2010, respectively, had continued to 2022 (dashed lines in Figure 1). Excess percentages use expected rates as denominators. Bold excess values indicate results where the 95% CI of relative excess excludes zero.
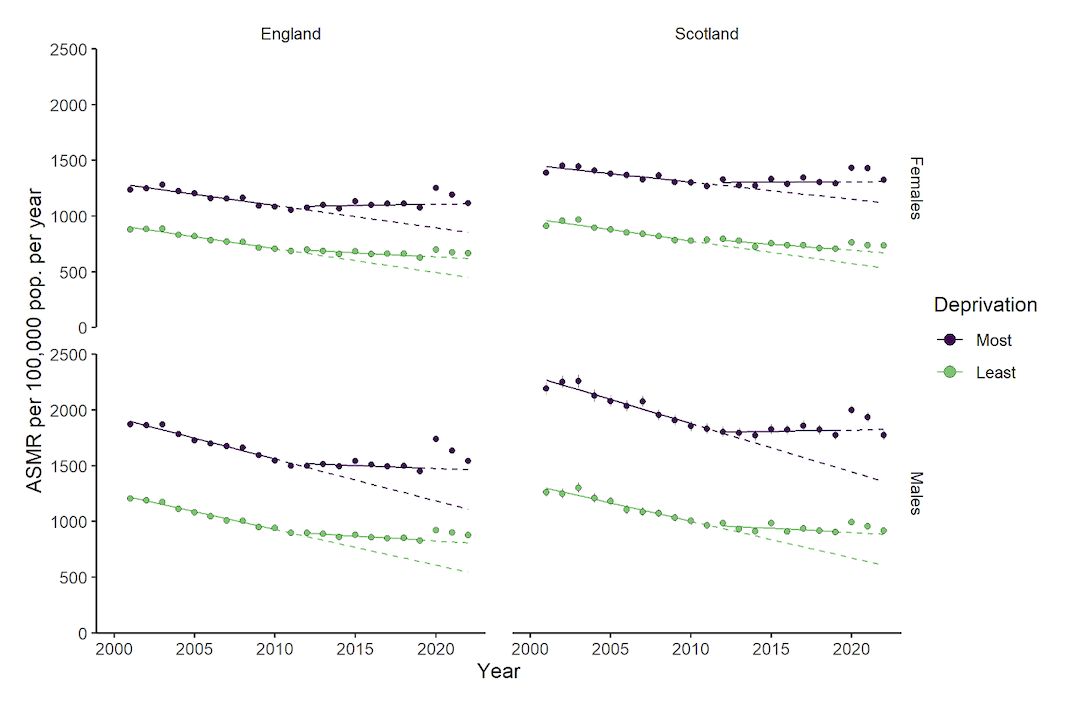
Figure 2: Age-standardised all-cause mortality (ASMR) rates from 2001–2022 in the most and least deprived fifths of the population.
Notes: Points are observed rates. Confidence intervals are included for observed rates but are so narrow as to be obscured by the points in most cases. Solid lines are trends fitted through 2001-2010 (pre-austerity) and 2012-2019 (austerity). Dashed lines are trends extrapolated to 2022.
|
Nation |
Sex |
Deprivation |
Obs. Rate |
Rate Ratio |
Exp. Rate |
Excess % |
|
England |
Females |
Most |
1117 |
1.68 |
1112 |
0.5 |
|
England |
Females |
Least |
667 |
|
618 |
7.9 |
|
England |
Males |
Most |
1541 |
1.75 |
1465 |
5.2 |
|
England |
Males |
Least |
878 |
|
809 |
8.6 |
|
Scotland |
Females |
Most |
1324 |
1.80 |
1311 |
1.0 |
|
Scotland |
Females |
Least |
735 |
|
673 |
9.3 |
|
Scotland |
Males |
Most |
1774 |
1.94 |
1826 |
-2.8 |
|
Scotland |
Males |
Least |
915 |
|
886 |
3.2 |
Table 2a: Age-standardised all-cause mortality rates per 100,000 population per year, rate ratios, and relative excess in ASMRs in 2022 in the most and least deprived areas, assuming continuation of austerity-era (2012-2019) trends.
|
Nation |
Sex |
Deprivation |
Obs. Rate |
Obs. Rate Ratio |
Exp. Rate |
Excess % |
|
England |
Females |
Most |
1117 |
1.68 |
855 |
30.7 |
|
England |
Females |
Least |
667 |
|
452 |
47.5 |
|
England |
Males |
Most |
1541 |
1.75 |
1110 |
38.8 |
|
England |
Males |
Least |
878 |
|
543 |
61.8 |
|
Scotland |
Females |
Most |
1324 |
1.80 |
1122 |
18.1 |
|
Scotland |
Females |
Least |
735 |
|
533 |
37.9 |
|
Scotland |
Males |
Most |
1774 |
1.94 |
1359 |
30.6 |
|
Scotland |
Males |
Least |
915 |
|
608 |
50.5 |
Table 2b: Age-standardised all-cause mortality rates per 100,000 population per year, rate ratios, and relative excess in ASMRs in 2022 in the most and least deprived areas, assuming continuation of pre-austerity (2001-2010) trends.
Notes: Deprivation – Most = most deprived areas, Least = least deprived areas. Exp. rate is the expected ASMR in 2022 if linear trends from the period 2012-2019 had continued to 2022 (dashed lines in Figure 2). Excess percentages are given using the expected rate point estimate as denominators only, ignoring the confidence intervals of the expected rates due to the limited number of datapoints which contribute to the models. Bold excess values indicate results where the 95% CI of the relative excess excludes zero.
|
Nation |
Sex |
Age Group (years) |
Excess % |
Excess % excl. C19 |
Reduction |
Prop. C19 deaths |
|
England |
Persons |
All |
5.6 |
-0.5 |
6.1 |
5.7 |
|
England |
Females |
All |
4.4 |
-1.1 |
5.5 |
5.3 |
|
England |
Males |
All |
7.2 |
0.5 |
6.8 |
6.1 |
|
England |
Females |
0-74 |
7.1 |
2.5 |
4.6 |
5.3 |
|
England |
Males |
0-74 |
8.8 |
4.3 |
4.6 |
6.1 |
|
England |
Females |
>74 |
6.6 |
1.1 |
5.6 |
5.3 |
|
England |
Males |
>74 |
7.5 |
1.2 |
6.3 |
6.1 |
|
England |
Females |
45-64 |
6.0 |
1.8 |
4.2 |
5.3 |
|
England |
Males |
45-64 |
7.4 |
3.6 |
3.8 |
6.1 |
|
England |
Females |
25-44 |
3.2 |
-0.1 |
3.3 |
5.3 |
|
England |
Males |
25-44 |
4.6 |
1.9 |
2.6 |
6.1 |
|
Scotland |
Persons |
All |
2.9 |
-3.5 |
6.5 |
6.2 |
|
Scotland |
Females |
All |
3.4 |
-2.8 |
6.1 |
6.0 |
|
Scotland |
Males |
All |
2.6 |
-4.3 |
6.9 |
6.5 |
|
Scotland |
Females |
0-74 |
3.1 |
-1.8 |
4.9 |
6.0 |
|
Scotland |
Males |
0-74 |
2.2 |
-2.4 |
4.5 |
6.5 |
|
Scotland |
Females |
>74 |
4.7 |
-1.8 |
6.5 |
6.0 |
|
Scotland |
Males |
>74 |
4.4 |
-2.3 |
6.7 |
6.5 |
|
Scotland |
Females |
45-64 |
1.5 |
-2.2 |
3.8 |
6.0 |
|
Scotland |
Males |
45-64 |
1.6 |
-2.4 |
4.0 |
6.5 |
|
Scotland |
Females |
25-44 |
-15.6 |
-18.6 |
2.9 |
6.0 |
|
Scotland |
Males |
25-44 |
-18.6 |
-20.2 |
1.5 |
6.5 |
Table 3: Relative excesses in observed age-standardised mortality rates per 100,000 population per year before and after excluding COVID-19 (C19)-related deaths in 2022, assuming continuation of austerity-era (2012-2019) trends.
Notes: Excess percentages are given using the point estimates of the expected rates as denominators. Bold excess values indicate results with 95% CI excluding zero. Reduction is the reduction in excess in percentage points after excluding COVID-19-related deaths. Proportion C19 deaths is the proportion of deaths in the age-sex subgroup where COVID-19 was mentioned on the death certificate. Absolute rates underlying the excess percentages reported here are presented in Table A3.
Discussion
Our findings reinforce concerns that mortality remains elevated after the peak years of the COVID-19 pandemic in the UK, even relative to changed mortality trends due to austerity. Part of the excess is due to high COVID-19 deaths in 2022, as seen elsewhere in Europe (Burström et al. 2024, Kuhbandner & Reitzner 2023, Raknes et al. 2024, Walkowiak et al. 2023). However, trends from 2012 to 2019 should not be accepted as normal. The change in mortality trends due to austerity was associated with an estimated 879,430 excess deaths between 2013-2022, comparable to the total number of British military deaths during World War One (Thompson et al. 2012). Although the deaths discussed in this study affected all parts of society, austerity has disproportionately harmed people in the most disadvantaged areas. Reversing austerity is crucial to mitigate the dramatic worsening of mortality trends seen since 2010.
This study’s findings broadly align with previous research employing different methods and time periods, while addressing limitations such as reliance on crude mortality or inappropriately short baseline periods that ignore important context around mortality trends since 2012. Pizzato and colleagues observed relative excess mortality of 5.0% in England and 5.2% in Scotland in 2022 using Poisson regression models fitted to mortality data from 2010–2019, compared to 5.6% and 2.9% in the present study (Pizzato et al. 2024). Pérez-Reche used linear regression on UK crude mortality rates from 2012–2019 to predict rates for 2022 and 2023 (Pérez-Reche 2024). In most age groups aged 30 or over, observed excesses were significant despite uncertainty in expected rates. Although methodologies differed, with this study using ASMRs, both found that the largest excesses occurred in older working age and older adults. In contrast, younger working age adults experienced more adverse trends during 2012–2019, while older groups showed modest annual improvements.
Although international comparisons should be made cautiously due to varying pandemic progressions, higher-than-expected mortality in 2022 has been reported worldwide (Hajdu et al. 2024, Kuhbandner & Reitzner 2023, Mostert et al. 2024, Raknes et al. 2024, Walkowiak et al. 2023). Walkowiak and colleagues (2023) reported post-pandemic excess mortality across Europe through 2022. They found post-pandemic excess was negatively associated with peri-pandemic excess, ranging from around -3% in Romania to 10% in Norway, with all included Western European countries showing relative excesses of 2.5-10%. Kuhbandner and Reitzner (2023) estimated a 6.6% excess mortality in Germany for 2022, comparable to that observed in England in this study. Using linear regression on 2012-2019 data, they found the 6.6% excess far exceeded predictions, even after accounting for uncertainty due to annual mortality variations. In Norway, Raknes and colleagues extrapolated all-cause ASMRs from 2010–2019 to 2022 and reported a relative excess of 13.7%, notably higher than in England and Scotland in this study (Raknes et al. 2024). The proportion of all deaths where COVID-19 was mentioned on the death certificate was, however, similar in England, Scotland, and Norway (5.7%, 6.2%, and 6.3% respectively). In line with international results, expected ASMRs based on austerity-era trends in our study indicate that COVID-19 accounts for a substantial portion of the observed excess mortality in England and Scotland in 2022. However, any excess mortality explained by COVID-19 is dwarfed by the excess related to the change in mortality trends following the imposition of austerity, which continues to accumulate even after achieving substantial control over COVID-19.
Our comparisons of recent observed ASMRs with long-term trend predictions add to and update a substantial evidence base documenting extraordinary changes in UK mortality rates since the early 2010s. These changes have been shown to have resulted in largest part from UK Government ‘austerity’ measures implemented from 2010 onwards (Martin et al. 2021, McCartney, McMaster et al. 2022, Prędkiewicz et al. 2022, Seaman et al. 2024, Walsh & McCartney 2024). UK Government spending was reduced by around £540 billion between 2010 and 2019, involving large cuts to social security and vital public services (via reductions in local government funding), which have profoundly harmed the health of the poorest and most vulnerable in society (Walsh & McCartney 2024). These policies were introduced in the UK and elsewhere internationally in response to the financial crisis of the mid/late 2000s and the (government-argued) need to reduce national debt accrued from the ‘bailout’ of banks. Although these policies took different forms in different countries, in the UK it was principally about enormous reductions to public spending. This was initiated by the Conservative/Liberal Democrat coalition government in 2010, and expanded by subsequent administrations. The causal pathways are well established, linking increased poverty (through cuts to social security) to loss of support services, increased stress, poorer mental health, and adverse behavioural ‘coping mechanisms’ (Elliott 2016, Gunasekara et al. 2011, McLean 2014, Russ et al. 2012, Walsh & McCartney 2024). Many studies have shown links between the main facets of austerity (cuts to social security and vital public services) and poorer mental health (defined and measured in different ways), increased drugs harms (Friebel et al. 2022, Koltai et al. 2021), multimorbidity (Stokes et al. 2022), and ultimately reduced life expectancy and increased mortality (Cherrie et al. 2021, Katikireddi et al. 2018, Kim et al. 2022). Several of these studies used statistical methods that enabled demonstration of a causal relationship between austerity ‘exposures’ and mortality (see appendix of Walsh & McCartney 2024). A series of analyses have shown that changes to mortality rates (and other adverse outcomes such as poverty-driven increases in premature births; Watson et al. 2024) started within approximately two years of the implementation of the policies (Fenton et al. 2019, McCartney, McMaster et al. 2022, Walsh et al. 2022).
As described in detail elsewhere (McCartney, Walsh et al. 2022, Walsh & McCartney 2024), other hypotheses for the changed mortality trends have been proposed and assessed. Many relate to the influence of individual diseases or health conditions (for example, slowed improvement in cardiovascular disease, annual variation in influenza, increases in drug deaths and deaths from dementia) which, among other reasons, are not congruent with the evidence that changes in mortality have been observed for all major causes of death, not just these specific examples, pointing instead to a shared, underlying, cause (Bennett et al. 2018, Ramsay et al. 2020). Proposed explanations relating to demographic and methodological influences have also been discounted on the basis of flawed or weak evidence (McCartney, Walsh et al. 2022). It has been demonstrated, however, that historical increases in obesity have contributed to the mortality changes – albeit only to a relatively small degree. Analyses by Walsh et al. (2022) showed that between 10% (males) and 14% (females) of the changes to mortality rates observed in Scotland in the period 2016-19 were potentially attributable to earlier increases in obesity in the population. The equivalent figures for England were 20% (males) and 35% (females), although assessment of potential biases suggested these figures were likely to be overestimates.
Evidence also shows that the effects of austerity on mortality trends in the UK have been made worse by both the COVID-19 pandemic and the post-pandemic high rates of inflation (‘cost of living crisis’). For example, Richardson et al. (2023) showed an estimated 6% increase (8% in the most deprived areas, 2% in the least) in death rates in Scotland for those aged under 75 years was attributable to high inflation. It is also important to understand the longer-term context of these trends. Even prior to the austerity-driven cuts to social security in the UK, levels of employment-replacement benefits were among the lowest of all OECD countries (OECD n.d.), falling well below levels required to pay for life’s ‘basic essentials’ (Bannister et al. 2023). The UK has therefore been subject to what might be called a ‘perfect’ storm’ of adversity, which has ultimately impacted on the health and mortality of its population. This has entailed: ineffective social security coverage (recently described by Amnesty International (2025) as ‘social insecurity’); further cuts to levels of (and eligibility for) those same social security benefits on an arguably unprecedented scale, cuts which have markedly increased poverty rates (with increases in child poverty in the UK between 2010 and 2019 having been shown by UNICEF to have been the worst of any high-income country (UNICEF Innocenti – Global Office of Research and Foresight 2023); the COVID-19 pandemic, which also disproportionately affected the poorest; and the post-pandemic ‘cost of living crisis’ which has further worsened mortality rates among those living with the least.
It is important to note that the UK is not alone in seeing adverse changes to mortality rates attributable to the implementation of austerity-related policies. Notable effects have been observed in the USA and several European countries including Greece, Spain and Iceland (Walsh & McCartney 2024). Analyses by McCartney et al. demonstrated that across all high-income countries, implementation of austerity measures had a negative impact on mortality, life expectancy and inequalities in life expectancy (McCartney, McMaster et al. 2022). In contrast, mortality trends in Japan – a country which did not introduce austerity measures – continued to improve (Walsh & McCartney 2024).
Strengths and Limitations
One strength of this study is its use of population-wide data for England and Scotland over two decades. Standardising ASMRs to the 2013 European Standard Population overcomes the shortcomings of raw death counts, which do not account for population changes or varying deprivation group structures. ASMRs also address the limitations of crude mortality rates that fail to adjust for changes in age and sex structure over time or between countries. By projecting ASMRs from longer pre-pandemic (2001-2010) and austerity-era (2012-2019) linear trends rather than using a five-year average, this study captures longer-term mortality shifts and provides a more accurate counterfactual than recent methods, including those published by the ONS.
This study also has limitations. We were unable to obtain mortality data (stratified by deprivation) beyond 2022; updating the analyses to include further years of data is therefore a key recommendation. ASMRs vary year-to-year, and this study did not account for that variability when defining excess mortality. Fitting linear regression models to only 11 years of data introduces uncertainty, especially when extrapolating 12 years beyond the fitting period, as it assumes a stable long-term trend that may not capture underlying fluctuations or structural changes. Using area-level deprivation measures yields smaller inequality gradients than individual measures due to misclassification (McCartney et al. 2023b). These indices include health outcomes, which potentially introduces endogeneity, though its impact on summary measures is minimal (Bradford et al. 2023, McCartney et al. 2023a). Defining COVID-19 deaths as any death mentioning COVID-19 rather than as the underlying cause may distort estimates of excess mortality from other causes. For example, in Scotland fewer than 60% of what we considered COVID-19 deaths in 2022 listed it as the underlying cause. However, many direct COVID-19 deaths are also attributable to austerity as highlighted in the ongoing public enquiry, making their exclusion from austerity-era excess mortality estimates highly conservative (Bambra & Marmot 2023).
Conclusions
This study has shown that mortality in 2022 remained higher than expected in England and Scotland, exceeding predictions based on both pre-pandemic austerity-era and pre-austerity trends. Our work overcomes key methodological limitations of earlier research and reveals that austerity has disproportionately impacted on the most socioeconomically disadvantaged groups. The findings suggest 879,430 excess deaths occurred between 2013 and 2022 in these nations due to changes in mortality trends linked to austerity. Although some excess mortality in 2022 is attributable to direct COVID-19 deaths, the dramatic ASMR changes since the early 2010s account for far more excess deaths; yet these changes receive far less attention. Improving UK mortality rates requires reversing the austerity-driven policies that underpin these trends, especially for those experiencing the most severe socioeconomic disadvantages.
Acknowledgments
We thank National Records of Scotland for providing mortality data and the Public Health Scotland Mortality Special Interest Group for their valuable feedback on the analysis.
Conflicts of interest
The authors declare they have no conflicts of interest.
Data availability statement
Data are available upon request from the Office of National Statistics and National Records of Scotland.
Funding
This work was funded by the Glasgow Centre for Population Health. RD and DB were supported by the Medical Research Council (MC_UU_00022/2) and the Scottish Government Chief Scientist Office (SPHSU17). The funders had no role in the design of the study or in the collection, analysis, and interpretation of data and results.
Ethics statement
This study used publicly available data and required no ethical approval.
ORCiD IDs
Daniel R. R. Bradford https://orcid.org/0000-0002-7523-8764
Denise Brown https://orcid.org/0000-0002-5195-5312
Gerry McCartney https://orcid.org/0000-0001-6341-3521
Margaret Douglas https://orcid.org/0000-0003-1560-5451
Ruth Dundas https://orcid.org/0000-0002-3836-4286
David Walsh https://orcid.org/0000-0002-3390-5039
References
Amnesty International (2025) Social insecurity—The devastating human rights impact of social security system failures in the UK. Amnesty International. https://www.amnesty.org.uk/knowledge-hub/all-resources/social-insecurity-report/
Bambra, C., & Marmot, M. (2023) Expert report for the UK Covid-19 Public Inquiry—Module 1: Health inequalities (No. INQ000195843). https://covid19.public-inquiry.uk/documents/inq000195843-expert-report-by-professor-clare-bambra-and-professor-sir-michael-marmot-dated-30-may-2023/
Bannister, L., Matejic, P., Porter, I., Sands, D., Schmuecker, K., Wenham, A., … & Hughes, A. (2023) An essentials guarantee—Reforming Universal Credit to ensure we can all afford the essentials in hard times. Joseph Rowntree Foundation and The Trussell Trust. https://www.jrf.org.uk/social-security/guarantee-our-essentials-reforming-universal-credit-to-ensure-we-can-all-afford-the
Benchimol, E. I., Smeeth, L., Guttmann, A., Harron, K., Moher, D., Petersen, I., … & Langan, S. M. (2015) The REporting of studies Conducted using Observational Routinely-collected health Data (RECORD) Statement. PLOS Medicine, 12(10), e1001885. https://doi.org/10.1371/journal.pmed.1001885
Bennett, J. E., Pearson-Stuttard, J., Kontis, V., Capewell, S., Wolfe, I., & Ezzati, M. (2018) Contributions of diseases and injuries to widening life expectancy inequalities in England from 2001 to 2016: A population-based analysis of vital registration data. The Lancet Public Health, 3(12), e586–e597. https://doi.org/10.1016/S2468-2667(18)30214-7
Bradford, D. R. R., Allik, M., McMahon, A. D., & Brown, D. (2023) Assessing the risk of endogeneity bias in health and mortality inequalities research using composite measures of multiple deprivation which include health-related indicators: A case study using the Scottish Index of Multiple Deprivation and population health and mortality data. Health & Place, 80, 102998. https://doi.org/10.1016/j.healthplace.2023.102998
Burström, B., Hemström, Ö., Doheny, M., Agerholm, J., & Liljas, A. (2024) The aftermath of COVID-19: Mortality impact of the pandemic on older persons in Sweden and other Nordic countries, 2020–2023. Scandinavian Journal of Public Health, 53(5), 456-464. https://doi.org/10.1177/14034948241253339
Cherrie, M., Curtis, S., Baranyi, G., Cunningham, N., Dibben, C., Bambra, C., & Pearce, J. (2021) A data linkage study of the effects of the Great Recession and austerity on antidepressant prescription usage. European Journal of Public Health, 31(2), 297–303. https://doi.org/10.1093/eurpub/ckaa253
De Haro Moro, M. T., Schofield, L., Munoz-Arroyo, R., McCartney, G., & Walsh, D. (2025) A new era of inequality: Profound changes to mortality in England, Scotland, and 10 major British cities. European Journal of Public Health, 35(2), 235–241. https://doi.org/10.1093/eurpub/ckaf008
Dobson, A. J., Kuulasmaa, K., Eberle, E., & Scherer, J. (1991) Confidence intervals for weighted sums of Poisson parameters. Statistics in Medicine, 10(3), 457–462. https://doi.org/10.1002/sim.4780100317
Elliott, I. (2016) Poverty and mental health: A review to inform the Joseph Rowntree Foundation’s Anti-Poverty Strategy. Mental Health Foundation. https://www.mentalhealth.org.uk/explore-mental-health/publications/poverty-and-mental-health
Fenton, L., Minton, J., Ramsay, J., Kaye-Bardgett, M., Fischbacher, C., Wyper, G. M. A., & McCartney, G. (2019a) Recent adverse mortality trends in Scotland: Comparison with other high-income countries. BMJ Open, 9(10), e029936. https://doi.org/10.1136/bmjopen-2019-029936
Fenton, L., Wyper, G. M. A., McCartney, G., & Minton, J. (2019b) Socioeconomic inequality in recent adverse all-cause mortality trends in Scotland. Journal of Epidemiology and Community Health, 73(10), 971–974. https://doi.org/10.1136/jech-2019-212300
Friebel, R., Yoo, K. J., & Maynou, L. (2022) Opioid abuse and austerity: Evidence on health service use and mortality in England. Social Science & Medicine, 298, 114511. https://doi.org/10.1016/j.socscimed.2021.114511
Georgina, A. (2020) PHEindicator methods: Common public health statistics and their confidence intervals [Manual]. https://CRAN.R-project.org/package=PHEindicatormethods
Gunasekara, F. I., Carter, K., & Blakely, T. (2011) Change in income and change in self-rated health: Systematic review of studies using repeated measures to control for confounding bias. Social Science & Medicine, 72(2), 193–201. https://doi.org/10.1016/j.socscimed.2010.10.029
Hajdu, T., Krekó, J., & Tóth, C. G. (2024) Inequalities in regional excess mortality and life expectancy during the COVID-19 pandemic in Europe. Scientific Reports, 14, 3835. https://doi.org/10.1038/s41598-024-54366-5
Katikireddi, S. V., Molaodi, O. R., Gibson, M., Dundas, R., & Craig, P. (2018) Effects of restrictions to Income Support on health of lone mothers in the UK: A natural experiment study. The Lancet Public Health, 3(7), e333–e340. https://doi.org/10.1016/S2468-2667(18)30109-9
Kim, C., Teo, C., Nielsen, A., & Chum, A. (2022) What are the mental health consequences of austerity measures in public housing? A quasi-experimental study. Journal of Epidemiology and Community Health, 76(8), 730–735. https://doi.org/10.1136/jech-2021-218324
Koltai, J., McKee, M., & Stuckler, D. (2021) Association between disability-related budget reductions and increasing drug-related mortality across local authorities in Great Britain. Social Science & Medicine, 284, 114225. https://doi.org/10.1016/j.socscimed.2021.114225
Kuhbandner, C., & Reitzner, M. (2023) Estimation of excess mortality in Germany during 2020-2022. Cureus, 15(5), e39371. https://doi.org/10.7759/cureus.39371
Loopstra, R., McKee, M., Katikireddi, S. V., Taylor-Robinson, D., Barr, B., & Stuckler, D. (2016) Austerity and old-age mortality in England: A longitudinal cross-local area analysis, 2007–2013. Journal of the Royal Society of Medicine, 109(3), 109–116. https://doi.org/10.1177/0141076816632215
Martin, S., Longo, F., Lomas, J., & Claxton, K. (2021) Causal impact of social care, public health and healthcare expenditure on mortality in England: Cross-sectional evidence for 2013/2014. BMJ Open, 11(10), e046417. https://doi.org/10.1136/bmjopen-2020-046417
McCartney, G., Hoggett, R., Walsh, D., & Lee, D. (2023a) How important is it to avoid indices of deprivation that include health variables in analyses of health inequalities? Public Health, 221, 175–180. https://doi.org/10.1016/j.puhe.2023.06.028
McCartney, G., Hoggett, R., Walsh, D., & Lee, D. (2023b) How well do area-based deprivation indices identify income- and employment-deprived individuals across Great Britain today? Public Health, 217, 22–25. https://doi.org/10.1016/j.puhe.2023.01.020
McCartney, G., McMaster, R., Popham, F., Dundas, R., & Walsh, D. (2022) Is austerity a cause of slower improvements in mortality in high-income countries? A panel analysis. Social Science & Medicine, 313, 115397. https://doi.org/10.1016/j.socscimed.2022.115397
McCartney, G., Walsh, D., Fenton, L., & Devine, R. (2022) Resetting the course for population health: Evidence and recommendations to address stalled mortality improvements in Scotland and the rest of the UK. Glasgow Centre for Population Health/University of Glasgow. https://www.gcph.co.uk/publications/1036_resetting_the_course_for_population_health
McLean, J. (2014) Psychological, social and biological determinants of ill health (pSoBid) in Glasgow: A cross-sectional, population-based study—Final study report. Glasgow Centre for Population Health. https://www.gcph.co.uk/assets/000/000/235/pSoBid_FINAL_REPORT_2013_update_February2014_original.pdf
Minton, J., Fletcher, E., Ramsay, J., Little, K., & McCartney, G. (2020) How bad are life expectancy trends across the UK, and what would it take to get back to previous trends? Journal of Epidemiology and Community Health, 74(9), 741-746. https://doi.org/10.1136/jech-2020-213870
Mostert, S., Hoogland, M., Huibers, M., & Kaspers, G. (2024) Excess mortality across countries in the western world since the COVID-19 pandemic: ‘Our World in Data’ estimates of January 2020 to December 2022. BMJ Public Health, 2(1). https://doi.org/10.1136/bmjph-2023-000282
National Records of Scotland (2023) Monthly Mortality Analysis, Scotland, December 2023. National Records of Scotland. https://www.nrscotland.gov.uk/files//statistics/vital-events/monthly-mortality/monthly-mortality-december-23-report.pdf
OECD (n.d.) Benefits in unemployment, share of previous income. OECD. https://www.oecd.org/en/data/indicators/benefits-in-unemployment-share-of-previous-income.html (Accessed 9 Jan 2026)
OECD (2023) Methodological note – All-cause, excess and COVID-19 deaths. OECD. https://stats.oecd.org/wbos/fileview2.aspx?IDFile=97aacc20-eac4-4e44-8f59-9fb5b7e25090
Office for National Statistics (n.d.) Population estimates. ONS. https://www.ons.gov.uk/peoplepopulationandcommunity/populationandmigration/populationestimates (Accessed 9 Jan 2026)
Office for National Statistics (2022, July 5) Mortality in England and Wales: Past and projected trends in average lifespan. ONS. https://www.ons.gov.uk/peoplepopulationandcommunity/birthsdeathsandmarriages/lifeexpectancies/articles/mortalityinenglandandwales/pastandprojectedtrendsinaveragelifespan
Office for National Statistics (2023a, March 9) Excess deaths in England and Wales: March 2020 to December 2022. ONS. https://www.ons.gov.uk/peoplepopulationandcommunity/birthsdeathsandmarriages/deaths/articles/excessdeathsinenglandandwalesmarch2020todecember2022/2023-03-09
Office for National Statistics (2023b, July 14th) Death registrations and populations by sex, age and IMD quintile, England and Wales: 2001 to 2020. ONS. https://www.ons.gov.uk/peoplepopulationandcommunity/birthsdeathsandmarriages/deaths/adhocs/1324deathregistrationsandpopulationsbysexageandimdquintileenglandandwales2001to2020
Office for National Statistics (2024a) Estimating excess deaths in the UK, methodology changes. ONS. https://www.ons.gov.uk/peoplepopulationandcommunity/healthandsocialcare/causesofdeath/articles/estimatingexcessdeathsintheukmethodologychanges/february2024
Office for National Statistics (2024b) Deaths registered weekly in England and Wales, provisional. https://www.ons.gov.uk/peoplepopulationandcommunity/birthsdeathsandmarriages/deaths/datasets/weeklyprovisionalfiguresondeathsregisteredinenglandandwales
Pérez-Reche, F. J. (2024) Age-specific all-cause mortality trends in the UK: Pre-pandemic increases and the complex impact of COVID-19. Public Health, 236, 361–364. https://doi.org/10.1016/j.puhe.2024.09.007
Pizzato, M., Gerli, A. G., Vecchia, C. L., & Alicandro, G. (2024) Impact of COVID-19 on total excess mortality and geographic disparities in Europe, 2020–2023: A spatio-temporal analysis. The Lancet Regional Health – Europe, 44. https://doi.org/10.1016/j.lanepe.2024.100996
Prędkiewicz, P., Bem, A., Siedlecki, R., Kowalska, M., & Robakowska, M. (2022) An impact of economic slowdown on health. New evidence from 21 European countries. BMC Public Health, 22(1), 1405. https://doi.org/10.1186/s12889-022-13740-6
Public Health England (2018) A review of recent trends in mortality in England. Public Health England. https://assets.publishing.service.gov.uk/media/5d652e19ed915d53aebba6ea/Recent_trends_in_mortality_in_England.pdf
R Core Team (2022) R: A language and environment for statistical computing [Computer software]. https://www.r-project.org
Raknes, G., Fagerås, S. J., Sveen, K. A., Júlíusson, P. B., & Strøm, M. S. (2024) Excess non-COVID-19 mortality in Norway 2020–2022. BMC Public Health, 24, 244. https://doi.org/10.1186/s12889-023-17515-5
Raleigh, V. (2022) What is driving excess deaths in England and Wales? BMJ, 379, o2524. https://doi.org/10.1136/bmj.o2524
Ramsay, J., Minton, J., Fischbacher, C., Fenton, L., Kaye-Bardgett, M., Wyper, G. M. A., Richardson, E., & McCartney, G. (2020) How have changes in death by cause and age group contributed to the recent stalling of life expectancy gains in Scotland? Comparative decomposition analysis of mortality data, 2000–2002 to 2015–2017. BMJ Open, 10(10), e036529. https://doi.org/10.1136/bmjopen-2019-036529
Richardson, E., McCartney, G., Taulbut, M., Douglas, M., & Craig, N. (2023) Population mortality impacts of the rising cost of living in Scotland: Scenario modelling study. BMJ Public Health, 1(1), e000097. https://doi.org/10.1136/bmjph-2023-000097
Russ, T. C., Stamatakis, E., Hamer, M., Starr, J. M., Kivimaki, M., & Batty, G. D. (2012) Association between psychological distress and mortality: Individual participant pooled analysis of 10 prospective cohort studies. BMJ, 345, e4933–e4933. https://doi.org/10.1136/bmj.e4933
Scott, F., McCartney, G., Walsh, D., Wild, S., Rae, D., Ramsay, J., Donaghy, G., & Douglas, M. (2024) Explanations for higher-than-expected all-cause mortality from April 2021: A scoping review. Public Health, 238, 73–82. https://doi.org/10.1016/j.puhe.2024.10.010
Seaman, R., Walsh, D., Beatty, C., McCartney, G., & Dundas, R. (2024) Social security cuts and life expectancy: A longitudinal analysis of local authorities in England, Scotland and Wales. Journal of Epidemiology and Community Health, 78(2), 82–87. https://doi.org/10.1136/jech-2023-220328
Stokes, J., Bower, P., Guthrie, B., Mercer, S. W., Rice, N., Ryan, A. M., & Sutton, M. (2022) Cuts to local government spending, multimorbidity and health-related quality of life: A longitudinal ecological study in England. The Lancet Regional Health - Europe, 19, 100436. https://doi.org/10.1016/j.lanepe.2022.100436
Thompson, G., Hawkins, O., Dar, A., & Taylor, M. (2012) The fallen: Military strength and deaths in combat. In Olympic Britain: Social and economic change since the 1908 and 1948 London Games (pp. 155--156). House of Commons Library. https://www.parliament.uk/contentassets/81be8c2610894681bded311344be967d/olympicbritain.pdf
UNICEF Innocenti – Global Office of Research and Foresight (2023) UNICEF Innocenti Report Card 18: Child poverty in the midst of wealth. UNICEF Innocenti. https://www.unicef.org/innocenti/media/3296/file/UNICEF-Innocenti-Report-Card-18-Child-Poverty-Amidst-Wealth-2023.pdf
Walkowiak, M. P., Domaradzki, J., & Walkowiak, D. (2023) Unmasking the COVID-19 pandemic prevention gains: Excess mortality reversal in 2022. Public Health, 223, 193–201. https://doi.org/10.1016/j.puhe.2023.08.004
Walsh, D., Dundas, R., McCartney, G., Gibson, M., & Seaman, R. (2022). Bearing the burden of austerity: How do changing mortality rates in the UK compare between men and women? Journal of Epidemiology and Community Health, 76(12), 1027–1033. https://doi.org/10.1136/jech-2022-219645
Walsh, D., & McCartney, G. (2024) Social murder? Bristol University Press.
Walsh, D., McCartney, G., Minton, J., Parkinson, J., Shipton, D., & Whyte, B. (2020) Changing mortality trends in countries and cities of the UK: A population-based trend analysis. BMJ Open, 10(11), e038135. https://doi.org/10.1136/bmjopen-2020-038135
Walsh, D., Tod, E., McCartney, G., & Levin, K. A. (2022) How much of the stalled mortality trends in Scotland and England can be attributed to obesity? BMJ Open, 12(12), e067310. https://doi.org/10.1136/bmjopen-2022-067310
Watson, R., Walsh, D., Scott, S., Carruthers, J., Fenton, L., McCartney, G., & Moore, E. (2024) Is the period of austerity in the UK associated with increased rates of adverse birth outcomes? European Journal of Public Health, 34(6), 1043–1051. https://doi.org/10.1093/eurpub/ckae154
Journal of Critical Public Health, Volume 3 (2026), Issue 2 CC-BY