Articles
Technology-Independent Algorithm for Collision Warning System at Semi-Controlled Intersections
Essam DabbourAssistant Professor, Department of Civil Engineering, Abu Dhabi University, United Arab Emirates
Said Easa
Department of Civil Engineering, Ryerson University, 350 Victoria Street, Toronto, ON, M5B 2K3
seasa@ryerson.ca
Date of receipt of final manuscript: January 2010
Abstract
Most of the collision warning systems that are available in the automotive market are mainly designed to detect imminent rear-end and/or lane-departure collisions. So far, no collision warning system is commercially available to detect imminent angle and turning collisions at semi-controlled intersections where the driver of a vehicle attempts to depart a minor road (controlled by a stop sign) to turn right, to turn left, or to cross an uncontrolled major road. One of the major causes for collisions at non-signalized intersections is the human error and misjudgment of the driver of the minor-road vehicle. Therefore, using a properly-designed collision warning system will have the potential to reduce, or even eliminate, this type of collision by reducing human error. This paper introduces a technology-independent algorithm for a collision warning system that can detect imminent collisions at semi-controlled intersections. The system utilizes commercially-available detectors to detect the approaching vehicles on the major road and calculate their speeds, accelerations, and rates of change of acceleration to estimate the time required to reach the intersection. The time required by the minor-road vehicle to clear the intersection is modeled as a function of driver and vehicle characteristics. By comparing the two times, the system displays a message for the driver of the minor-road vehicle when the departure maneuver is safe. An application example is provided to illustrate the proposed algorithm.1.0 Introduction
1 Angle and turning collisions at intersections are one of the most common types of collisions that have higher rates of fatalities and injuries than other types of collisions. In Ontario, Canada, there were 56,257 such collisions in 2006 that caused 133 fatalities and 14,456 injuries (Ministry of Transportation of Ontario, 2006). This is compared to 59,221 rear-end collisions that caused 39 fatalities and 13,238 injuries. Despite the fact that intersection collisions are more frequent and more severe than rear-end collisions, most of the collision warning systems available in the automotive market are designed to detect potential rear-end and/or lane-departure collisions (NHTSA, 2000; Brown et al., 2000; Dravidam and Tosunoglu, 2000; Taylor, 2005; VORAD, 2009).
2 One of the main factors that may lead to collisions at non-signalized intersections is the driver’s misjudgment of the speed and acceleration of the vehicles in the cross traffic stream on the major road, which resulted in approximately 36.1% of collisions at non-signalized intersections (Pierowicz et al., 2000). This inadequacy in judging the speed and acceleration of other vehicles is common among drivers with some variations due to age, health conditions and other factors. Although the human visual system is extremely sophisticated, psychophysical evidence found that it was insensitive to the acceleration of objects with no direct perceptual mechanisms to support the perception of acceleration (Watamaniuk and Duchon, 1992). A properly-designed collision warning system might mitigate this problem by detecting and analyzing all the information, including reaction time and acceleration rate of the driver of the minor-road (equipped) vehicle, and giving a visual, auditory, or haptic signal to the driver of the equipped vehicle to start the departure movement when conditions are safe.
3 Limited research efforts have been directed to designing vehicle-mounted warning systems for intersection collisions, including the Intersection Collision Avoidance (ICA) system developed by the Calspan SRL Corporation (Pierowicz et al., 2000);, the Intersection Crash Avoidance Violation warning system (ICAV) proposed by Virginia Tech Transportation Institute (NHTSA, 2004); and the INTERSAFE system developed by the European Commission (Fuerstenberg and Chen, 2007). The main features of these systems are presented in Table 1. Each of those systems used a pair of detectors (either radar sensors for the ICA and ICAV systems or laser scanners for the INTERSAFE system) installed at the left and right front corners of the equipped vehicle to detect the approaching vehicles, determine their speeds and time-to-collision, and trigger a warning if they are found to be conflicting with the path of the equipped vehicle. However, none of those research projects have considered measuring the acceleration of the detected vehicles or the time required for the driver of the equipped vehicle to perceive the message given by the system and react to it. The desired acceleration rate of the driver of the equipped vehicle is another human factor that has not been considered by these previous research projects.
4 This paper proposes a conceptual framework for a technology-independent collision warning system that can detect imminent angle and turning collisions at semi-controlled intersections by utilizing a pair of detectors (either radar sensors or laser scanners). Unlike other proposed systems, this system models the variations among drivers in their perception-reaction times (PRT) and departure acceleration characteristics. The following section presents the proposed warning system, including technical specifications, system algorithm, and other aspects. Application of the system is then illustrated using an example. The limitations of the system are then discussed, followed by concluding remarks.
Table 1. Comparison of different vehicle-based intersection collision warning systems

2.0 Proposed Warning System
5 Similar to the existing warning systems, the proposed system utilizes a pair of detectors installed at the left and right front corners of the equipped (target) vehicle to detect approaching (bullet) vehicles on the major road, as shown in Figure 1. Using the detectors, along with a processing unit and a driver-vehicle interface unit, the system determines whether a ‘Not Safe’ or ‘Proceed with Caution’ message should be displayed to the driver of the target vehicle.
2.1 Minimum Technical Specifications of Detectors
6 Each detector (either radar sensor similar to the ICA and ICAV systems, or laser scanner similar to the INTERSAFE system) sends a beam every time interval, t, to scan the cross-traffic lanes on the major road. The time interval ranges from 0.04 sec to 1.5 sec, depending on the type of the detector used. Based on previous research (NHTSA 2004) an update rate of 10 Hz, with 0.1 second time interval, is recommended to provide acceptable range and range-rate resolution. The opening angles of the left and right detector are denoted by P L2 and P R2 , respectively. The width of the beam is designed so that the angle between the outer left edge of the beam and the face plane of the vehicle P L1 can detect the approaching vehicles from the left within a safe intersection sight distance for a typical semi-controlled two-way stop-controlled (TWSC) intersection (and similarly for P R1 for the right direction). From geometric design guides, the intersection sight distance for a design speed of 70 km/h is 150 m (American Association of State Highway and Transportation Officials, 2004). This design speed was selected as it is the maximum design speed for a major urban road. It should be noted that the sight distance is used here for the purpose of selecting the appropriate opening angle for the detectors. The actual distance between the approaching bullet vehicle and the intersection is calculated based on the actual detected location, speed, and acceleration rate of the bullet vehicle.
Figure 1. Typical system configuration at a non-signalized intersection

Display large image of Figure 1
7 For vehicles approaching from the left side (Figure 1), the angle with the plane face of the vehicle, is 0° (conservatively assuming no setback). To detect vehicles in the near lane, the opening (azimuth) angle equals tan (150/3.5) which yields an opening angle of approximately 88°. For vehicles approaching from the right side, another detector is used with an angle with the plane of the vehicle approximately equal to tan (3.5/150) or 1.3°. The opening angle equals tan (150/7) or approximately 87° to detect vehicles in the near lane (this angle is calculated assuming one lane in each direction of the major road with no setback, which would be conservative for roads with more lanes).
8 Based on the preceding considerations and previous research (United States Department of Transportation, 2003; NHTSA, 2004), the required specifications for the proposed detectors are as follows:
- Maximum range ≥ 150 m (to detect all vehicles on the major road that may collide with the target vehicle).
- Opening (azimuth) horizontal angle = 87° - 88°.
- Opening (azimuth) vertical angle = 4°- 8°.
- Minimum azimuth angle resolution = 0.1°.
- Maximum data latency = 0.05 sec.
- Range resolution ≥ 0.5 m (given the small cycle time).
- Update rate = 10 Hz, with 0.1-sec time interval (t).
9 These minimum specifications are technology-independent and further research will be required to select the product that meets them. Possible candidates include the following:
- The EVT-200 radar sensor produced by Eaton VORAD Technologies (VORAD, 2009). This sensor was used by the ICA system (Pierowicz et al., 2000). However, the opening angle for this sensor is smaller than the required angle and therefore technical modifications will be required to increase its opening angle (e.g., by using a rotating antenna).
- The UMRR-009xx radar sensor produced by Smart Microwave Sensors (2009). This sensor may meet the minimum required specifications. However, given that it is fully customized, its price may be too high to be implemented for commercial applications.
- The LUX laser scanner produced by IBEO Automobile Sensor (IBEO, 2009). This sensor is being used by the INTERSAFE system (Fuerstenberg and Chen, 2007). However, further research may be required to ensure its functionality under different weather conditions.
2.2 System Algorithm
10 The algorithm procedures are as follows (Figure 2):
- Once the brakes are activated for a full stop and the system detects cross-traffic vehicles, as in a typical TWSC intersection situation, the system displays by default a ‘Not Safe’ message for the driver. This message could be visual, auditory, haptic, or a combination. The message is not deactivated until the algorithm confirms that a safe departure is available.
- The system estimates the time required for each vehicle detected in the cross-traffic stream to reach the intersection, t bullet .
- The system estimates the time required for the stopped vehicle to safely depart the intersection, t target .
- The system compares the times from 2 and 3 and makes a decision according to the following criteria:
- If t target is greater than or equal to t bullet , the ‘Not Safe’ message continues to be displayed and the system repeats the algorithm; or
- If t target is less than t bullet , a ‘Proceed with Caution’ message is displayed to the driver of the equipped vehicle to allow him/her to depart the intersection.
11 The proposed algorithm tracks different approaching vehicles on all lanes and the above procedures are followed for each vehicle with the ‘Not Safe’ message displayed until all lanes are clear of approaching vehicles that may collide with the turning vehicle. Similar to the preceding ICA, ICAV and INTERSAFE systems, vehicle tracking is achieved by using a Kalman filter (Kalman 1960). The Kalman filter performs tracking by estimating the state of dynamic objects (i.e., the approaching vehicles) at different times from a series of incomplete and noisy measurements (taken by detectors) and provides accurate continuously-updated information about the position and speed of the approaching vehicles. A bounding box is placed around the predicted positions of approaching vehicles and logic is used to determine if the detection is within that bounding box and hence is associated with a specific track. More information about vehicle tracking using the Kalman filter can be found in the literature (Maybeck, 1979; Grewal and Andrews, 1993; and Pierowicz et al., 2000).
12 The time anticipated for the bullet vehicle to reach the intersection, tbullet, and the time required for the target vehicle to depart the intersection, ttarget, are affected by the intended movement of the target vehicle and the travel direction of the bullet vehicle, as illustrated in Figure 3. There are three possible cases, as follows:
- The paths of the target and bullet vehicles are parallel with no conflict (Figure 3a). An example of this case is when the target vehicle is turning right and the bullet vehicle is approaching from the right. In this situation, there is no conflict and a ‘Proceed with Caution’ message is displayed (unless other objects are detected by the sensors for the other situations).
- The paths of the target and bullet vehicles are perpendicular to each other (Figure 3b). This case occurs when the target vehicle is turning left and the bullet vehicle is approaching from the left or when the target vehicle is traveling straight and the bullet vehicle is approaching from either the left or the right. In this case, the algorithm calculates the anticipated time for the bullet vehicle to reach the intersection and compares it to the required time for the target vehicle to clear the path of the bullet vehicle.
- The target and bullet vehicles are traveling on the same lane in the same direction (Figure 3c). This case occurs when the target vehicle is turning right and the bullet vehicle is approaching from the left on the same lane, or when the target vehicle is turning left and the bullet vehicle is approaching from the right on the same lane. In this case, the algorithm calculates the time required for the target vehicle to accelerate to 70% of the speed of the bullet vehicle as recommended by the American Association of State Highway and Transportation Officials (2004). The algorithm also determines the distance from the intersection to the conflict point where the target vehicle completes its acceleration to 70% of the speed of the bullet vehicle. The algorithm then computes the anticipated time for the bullet vehicle to reach the conflict point and compares it to the required time for the target vehicle to reach the same point.
13 Note that the flashing turning signal of the equipped vehicle, activated by its driver, provides the required information for the algorithm to determine the intended departure path of the target vehicle, while the signal received from the detectors provides the required information about the path of the approaching vehicles. It is assumed that the drivers will always use the signal indicator when turning. In all cases, the system does not commence until the brakes are activated in a full stop. The modeling of the bullet vehicle location and the bullet and target vehicle times the two conflict cases described above is presented in the next section.
Figure 2. Flow chart for the proposed algorithm Figure 3. Conflict cases for a typical TWSC intersection: (a) paths of target and bullet vehicles are parallel with no conflict, (b) paths of target and bullet vehicles are perpendicular, and (c) target and bullet vehicles are in the same direction and the same lane.

2.3 Bullet Vehicle Location
14 To calculate the time required for a detected bullet vehicle to reach the intersection, tbullet, a detection beam is generated, from one of the two detectors, at time T to scan the cross-traffic lanes. If no object is detected from both detectors, or if a vehicle is detected approaching from the right while the equipped vehicle’s intended path is to turn right, a ‘Proceed with Caution’ message is displayed to the driver. Otherwise, the nearest vehicle detected, vehicle A, is recorded at range d1 and azimuth angle θ1 where polar coordinates are used with the origin point coinciding with the location of the radar sensor that detected the vehicle (Figure 4a).
15 Another detection beam is generated, from the same detector, at T+t, where t is the time interval of the detector, and the new location of vehicle A is recorded at range d2 and azimuth angle θ2 (Figure 4b). If d1 and d2 were found to be equal to each other, the algorithm concludes that the object is not moving (e.g., a tree or a building), and a ‘Proceed with Caution’ message is displayed (unless another object is detected by any of the two detectors). If d2 was found to be greater than d1, the algorithm concludes that the object is moving away from the turning (target) vehicle, and a ‘Proceed with Caution’ message is also displayed to the driver (unless another object is detected by any of the two radar sensors). Finally, if d2 was found to be less than d1, the distance traversed by the approaching vehicle during the first time interval, dv1, is calculated as (Figure 5)

16 Similarly, a third and a fourth radar beams are generated at T+2t and T+3t, respectively. The information for the bullet vehicle at each time is recorded, (d3, θ3) and (d4, θ4), respectively. The distances traversed by the vehicle during the second and third time intervals, dv2 and dv3, respectively are calculated similar to calculating dv1. Assuming a linear time-dependant acceleration model, the rate of change in acceleration, r, can be calculated by the following equation:

The acceleration, speed, and distance at any time, t, can be directly computed by integrating the above equation three consecutive times. At T+t, for example, these parameters are given by


Similarly, the same parameters associated with the second and third time intervals can be computed as follows:


By solving the above equations together, the rate of change in acceleration is then given by

where dv1, dv2, and dv3 are the distances at T+1t, T+2t, and T+3t, respectively.
17 The side offset between the bullet vehicle and the target vehicle, wf, is computed as the mean value to reduce the likelihood of reading errors:
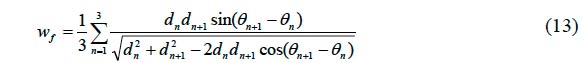
18 Note that the side offset wf, can be used to help reduce unnecessary warning signals when the target vehicle is turning right while the bullet vehicle is approaching from the left. If the side offset, wf, exceeds the sum of the lane width and the setback, this indicates that the bullet vehicle is not traveling on the nearest lane, which is occupied by the turning target vehicle, and in this case a ‘Proceed with Caution’ message can be displayed by the system (unless other vehicles are detected). In applying this criterion, the conservative approach is to implement the maximum values for the lane width and setback presented by the design guides ransportation Association of Canada, 2007; American Association of State Highway and Transportation Officials, 2004).
19 The distance from the bullet vehicle (at T+3t) to the intersection, df, is given by (Figure 6)

20 Based on the conflict type between the bullet and target vehicles (perpendicular paths or traveling on the same lane), the bullet time, tbullet, and target time, ttrget, can be computed as described in the next two sections.
2.4 Conflicting Vehicles have Perpendicular Paths
2.4.1 Bullet Vehicle Time
21 When the bullet and target vehicles have perpendicular paths (Figure 3b), the bullet time, tbullet, is the smallest positive real root of the following polynomial (Dabbour and Easa, 2009).

where df, vT+3t, aT+3t, and r are given by Equations 14, 10, 9, and 12, respectively. If Equation 15 returns no positive roots, the system triggers a ‘Proceed with Caution’ message as this indicates that the approaching vehicle is decelerating for a full stop before reaching the intersection. If more than one positive root were returned, the smaller one is used by the system for further calculations.
Figure 4. Measuring range and azimuth angle at T and (T+t)

Display large image of Figure 4
22 To keep the system consistent with driver’s habits without causing nuisance, the bullet time calculated by the system should not be less than 7.5 seconds plus 0.5 seconds for each additional lane that should be crossed, where the number of lanes to be crossed is determined from the side offset calculated by Equation 13. This is based on previous studies that reported that a passenger car driver who is departing a minor road onto a two-lane major road in a TWSC intersection mentally needs the above minimum value for the total gap available for departure (American Association of State Highway and Transportation Officials, 2004; Harwood et al., 1996). If the bullet time calculated by the system was found to be less than the minimum gap required, the system would not trigger a ‘Proceed with Caution’ message even if the target time was found to be less than the bullet time calculated by the system. However, this additional condition may be eliminated eventually in a later stage after the driver gets used to the system and gains more confidence in it.
Figure 5. Calculating traversed distance during the first time interval Figure 6. Schematic illustration of bullet vehicle locations at (T+2t) and (T+3t)

2.4.2 Target Vehicle Time
23 The total time required for the driver of the target vehicle to clear the intersection is given by

where t1 is driver’s PRT and t2 is the travel time required for the target vehicle to accelerate and clear the path of the approaching bullet vehicle.
2.4.3 Perception-reaction Time
24 The driver’s perception-reaction time, t 1 , is different for the cases of a vehicle with and without a collision warning system. For a vehicle with a collision warning system, the PRT is the time required to perceive the message given by the collision warning system and react accordingly by activating the throttle. On the other hand, for a vehicle without a collision warning system, the driver has to perceive the whole situation, analyze it, make a decision, and take the appropriate action by activating the throttle. Theoretically, the PRT for a vehicle with a collision warning system is expected to be less than that for a vehicle without one due to the fewer mental tasks performed by the driver (no analysis or decision-making required). However, this expectation is influenced by several factors, including the reliability of the warning system and driver’s familiarity and trust with it.
25 To address the preceding issues, a regression model was developed to model the driver’s PRT in terms of the driver’s gender and age. The model was developed using data collected from 60 drivers representing both genders and different age groups as shown in Table 2. The sample was selected to proportionally represent the population of licensed drivers in Canada (Transport Canada, 2003). Every driver was asked to drive simulation scenarios on the STISIM driving simulator (STISIM, 2009) located at Ryerson University (Canada). The scenarios were designed to simulate a series of non-signalized intersections where drivers were asked to perform all available departure maneuvers (turning left, turning right and crossing). The algorithm was encoded into the scenarios so that at each intersection the driver would hear a buzz signal indicating that it was not safe to depart the intersection. The driver was instructed to depart the intersection as soon as the buzz signal stops for that intersection. The data collected included the PRT for the driver measured from the time the buzz signal stops to the time when he/she starts to engage the throttle to start departure. A total of 2160 observations were used to calibrate the regression model which is given by

where t1 is the PRT for the driver, AGE is the age of the driver (in years), and GENDER is a dummy variable that represents driver’s gender (0 for male and 1 for female). The coefficients of all independent variables were significantly different from zero at the 95% confidence level.
Table 2 Sample selection compared to licensed drivers in Canada (2003 data)

2.4.4 Driver’s Acceleration Rate
26 The acceleration rate selected by the driver is the maximum acceleration rate provided by the mechanical characteristics of the vehicle (as given by the vehicle’s performance data) multiplied by a correction factor, cd, that depends on driver’s characteristics as well as on the distance and speed of the nearest approaching vehicle. A regression model was calibrated using observations taken from the same driver sample used for calibrating the PRT model. The model is given by

where cd is the driver’s correction factor for the acceleration rate, df is the distance (in meters) to the nearest detected approaching vehicle (as was calculated from Equation 14), vT+3t is the detected speed (m/sec) of the nearest approaching vehicle during the last time interval used by the algorithm (as was calculated from Equation 10), and GENDER and AGE are as previously defined. The coefficients of all independent variables are significantly different from zero at the 95% confidence level. The signs of all the variables are logical.
2.4.5 Travel Time
27 The vehicle travel time, t2, when the bullet and target vehicles have perpendicular paths (Figure 3b), is computed as follows. First, the total distance to be crossed by the target vehicle, S, is calculated by

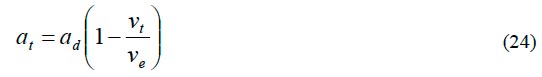
where wf is the offset, L is the length of the target vehicle, and CW is a correction factor. This factor corrects for the distance between the ‘reflective’ point (or the centre of a cluster of reflective points) in the approaching vehicle detected by the sensor and the far edge of the approaching vehicle to ensure safe departure. The reflective point detected by the sensor should be determined based on the technical specifications of the sensor used. If the reflective point is located at the near edge of the approaching vehicle, CW equals the full width of the approaching vehicle, which is typically 2.13 m (American Association of State Highway and Transportation Officials, 2004). If the reflective point is located at the centre of the approaching vehicle, CW equals a half vehicle width, and if the reflective point is located at the far edge of the approaching vehicle, CW equals zero. Using the linear decay acceleration model (Drew, 1968; Long, 2000), the acceleration of the target vehicle at any time can be computed by the following equation:
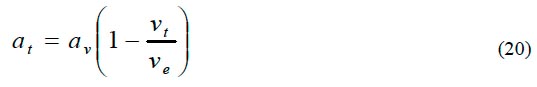
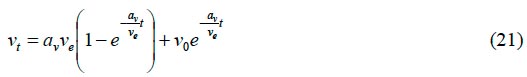
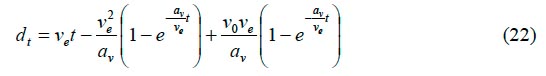
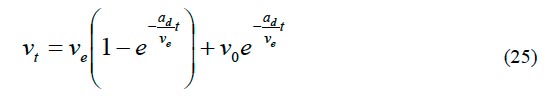
where at is the acceleration rate at time t; av is the maximum acceleration rate provided by the mechanical characteristics of the vehicle at the start of its movement; vt is the speed of the vehicle at time t; and ve is the equilibrium speed (the crawl speed) where the acceleration decreases to zero, which also depends on the mechanical characteristics of the vehicle. By integrating Equation 20, the following two equations compute speed, vt, and distance, dt, at any time t:
28 The driver’s desired acceleration, ad, is based on driver’s characteristics as well as on vehicle performance. This can be represented by the following equation:

where Cd is the driver’s correction factor for the acceleration rate as computed by Equation 18. The acceleration, at, speed, vt, and distance, dt, at any time t can be computed from the following equations:
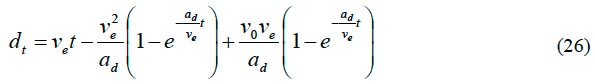
29 The time required for crossing, t2, is then computed by solving the following equation

where the only unknown variable is the crossing time, t2.
2.5 Conflicting Vehicles Travelling on the Same Lane
30 Where both the target and bullet vehicles travel on the same lane (Figure 3c), the conflict point is located somewhere between the intersection and point B, which is the location where the target vehicle accelerates to 70% of the speed of the bullet vehicle (as shown in Figure 7). The conflict scenario is summarized as follows:
Figure 7. Geometry for conflicting vehicles travelling on the same lane

Display large image of Figure 7
- At time T+3t, the target vehicle is still in a stop position while the bullet vehicle is traveling at acceleration aT+3t, and speed vT+3t, which are computed using Equations 9 and 10, respectively.
- Let PRTb be the perception-reaction time for the driver of the bullet vehicle. Then, at T+3t+t1+PRTb, the target vehicle has already started the departure movement while the driver of the bullet vehicle has just perceived the departure of the target vehicle and just started to reduce his speed accordingly. The perception-reaction time required for the driver of the bullet vehicle to perceive the departure of the target vehicle is selected as 2.5 s according to the American Association of State Highway and Transportation Officials (2004). The acceleration and speed at T+3t+t1+ PRTb and the distance traversed during (t1+ PRTb)
are given, respectively, by:

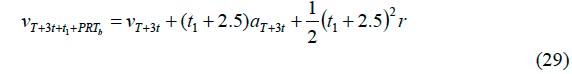

- At time T+3t+t1+t2, the target vehicle has just finished its acceleration to 70% of the speed of the bullet vehicle (measured at T+3t+t1+ PRTb) at point B that is located at distance x2 from the intersection. The time t2 required for the target vehicle to accelerate to 70% of the speed of the bullet vehicle can be derived as
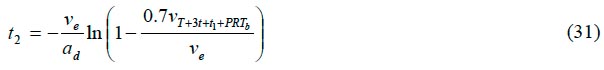
where is given by Equation 29, ve is the equilibrium (crawl speed) that is pre-loaded to the algorithm from the mechanical characteristics of the equipped target vehicle, and ad is calculated from Equation 23.
 - The distance x5 required for the target vehicle to accelerate to 70% of the speed of the bullet vehicle (at T+3t+ PRTb) is given by

- The distance x2, along the path of the bullet vehicle, between the intersection and point B is given by

- The time required for the bullet vehicle to reach point B, tbullet, is calculated as follows. The time required to decelerate from speed to 70% of that speed using a comfortable deceleration rate of 3.4 m/s2 (American Association of State Highway and Transportation Officials, 2004) is given by

- The time required to travel at constant speed 0.7 to reach point B is given by

- The distance x3 where the bullet vehicle travels at a constant speed 0.7 equals (x3 = x1 + x2 - x4), where x1 = df – dv5 (where df and dv5 are calculated from Equations 15 and 30, respectively) and x2 is calculated from Equation 33. The distance x4 is the distance traveled by the bullet vehicle while decelerating from to 0.7 which is given by

- Finally, the times required for the bullet vehicle to reach B are given, respectively, by

For the target vehicle, the time required to reach the conflict point, t target, is given by Equation 16 where t1 and t2 are calculated from Equations 17 and 31 respectively.
3.0 Application Example
31 Assume a target vehicle with a length of 4.2 m, a maximum rate of acceleration of 5.25 m/sec2 and an equilibrium speed of 40 m/sec [144 km/hr]. The driver of that target vehicle is turning left from a minor road, controlled by a stop sign, into an uncontrolled major road. The driver is a 32 year old male. Using a detector with interval time of 0.5 sec (update rate 2 Hz), a cross-traffic vehicle was detected approaching from the left with four consecutive readings for the range found to be 125.17 m, 115.09 m, 104.82 m and 94.35, respectively. The corresponding azimuth angle readings were 2.98°, 3.24°, 3.56° and 3.95°, respectively.
32 From Equation 1, the distance traversed by the approaching bullet vehicle during the three detection intervals are 10.095 m, 10.288 m and 10.492 m. From Equation 12, the rate of change of acceleration, r, is calculated as 0.088 m/sec3. From Equation 13, the side offset between the bullet and target vehicles is calculated as 6.50 m. The distance from the bullet vehicle (at T+3t), to the intersection, df, is calculated from Equation 14 and found to be 94.13 m. Based on that, the bullet time, tbullet, is calculated from Equation 15 and found to be 4.09 seconds.
33 As per Equation 16, the target time, ttarget, is the sum of the perception-reaction time, t1, and the target vehicle’s acceleration time, t2. From Equation 17, the perception-reaction time, t1, is found to be 1.26 seconds. From Equation 18, the correction factor for the departure acceleration rate, cd, is found to be 0.92; and therefore, from Equation 20, the driver’s departure acceleration rate is 4.83 m/sec2. From Equation 19, the total distance to be crossed by the target vehicle, S, is calculated as 12.83 m (assuming that the reflective point is located at the near edge of the approaching vehicle); and therefore, the target vehicle’s acceleration time, t2, is calculated as 2.31 seconds from Equation 27. Based on that, the total target time, ttarget, should be 3.57 seconds. Since ttarget is found to be less than tbullet, the system should display a ‘Proceed with Caution’ message to the driver. If the driver of the equipped vehicle is older, his perception-reaction time will be longer and his selected acceleration will be slower; and therefore, a ‘Proceed with Caution’ message may not be warranted. The maximum acceleration rate provided by the mechanical characteristics of the target vehicle is another important factor that influences the decision made by the warning system. For example, if the maximum rate of acceleration is 4.50 m/sec2 or less, the target vehicle’s acceleration time, t2, will increase and a ‘Proceed with Caution’ message may not be warranted.
4.0 Limitations of Proposed System
34 The proposed methodology for the in-vehicle collision warning system represents a first step toward a complete system, but it still has a number of issues and limitations that need to be resolved. These limitations include the following:
- The proposed system is not designed for operations in adverse weather conditions. Furthermore, the system is designed on the assumption of well-maintained road with no significant rutting. In some cases, minor roads may not be as well maintained as the major road, especially in rural areas, which may result in tire slippage as a result of either accumulated snow or poor pavement surface conditions. In that case, the target vehicle will depart the intersection slower than calculated by the system and may end up in the path of traffic. However, most systems, such as adaptive cruise control, are not normally designed based on slippery snowy or poor pavement conditions. Designing a system on that basis will result in the system causing nuisance to the driver under normal conditions. It is possible, however, to resolve this limitation by linking the proposed system to the Anti-lock Braking System (ABS) in the equipped vehicle so that if the ABS system detects slippery conditions, the proposed warning system would automatically be deactivated. The system would then provide a proper message to the driver that the system is deactivated due to slippery conditions. In addition, large snow banks might obstruct the detection signal used by the system. The proposed system requires clear line of sight exactly similar to the human eye. Therefore, since snow banks will reduce the available sight distance they will also reduce the functionality of the proposed system. The driver will easily recognize the reduced system functionality due to the reduced sight distance and is expected to react accordingly. The objective of the proposed system is not to address those unusual environmental conditions, but rather to assist the driver in perceiving the speed and acceleration of the approaching vehicles under normal driving conditions. It is expected that in adverse weather conditions, the driver would be more attentive and exercise more caution.
- This research, which is technology-independent, does not fully explore all the technical details of the radar/laser sensors. For example, pedestrians are usually not detected by most of the radar/laser sensors (depending on the specific technology used). The proposed algorithm assumes that pedestrians are not detected and therefore they are not part of the calculations. The driver of the equipped vehicle should visually ensure that his/her departure does not impose any risk for pedestrians who are crossing the intersection. Although the proposed system provides guidance for the driver of the equipped vehicle, as either ‘Not Safe’ or ‘Proceed with Caution’ message, the driver must be vigilant to other risk factors that are not accounted for by the proposed system, including pedestrians. If the presence of pedestrians obstructs the line of sight between the driver of the equipped vehicle and the approaching vehicles, the driver will not be able to see the approaching vehicles and the radar/laser detector will not be able to detect them as well. The current usual practice for most drivers (when their vehicles are not equipped with the proposed system) is that they do not depart the intersection if pedestrians are obstructing the line of sight to the approaching vehicles and they simply wait until they have adequate sight distance to ensure safe departure. A similar course of action should be taken by the drivers with in-vehicle collision warning system. It should be noted, however, that most available vehicle technology sensors can detect other moving objects such as motorcycles and cyclists. They can also detect different classes of cars and trucks, and other large vehicles such as buses and recreational vehicles.
- The sensors of the equipped vehicle would not detect a vehicle that may be departing the other minor approach. If this occurs, the driver of the equipped vehicle should clearly see it and would not depart until the other vehicle completes its departure. It should be noted that the proposed system is not meant to be an “Auto Pilot” that automates the whole driving process, but is rather an aid for the driver to determine the motion characteristics of the approaching vehicles and to inform the driver of the equipped vehicle when it is safe to depart. In fact, this limited scope of the proposed system has the potential to improve road safety. As noted earlier, one of the most leading factors that may lead to intersection collisions is driver misjudgment of the speed and acceleration of the approaching vehicles that resulted in approximately 36.1% of collisions at intersections (Pierowicz et al.. 2000). The proposed system has the potential to reduce (or even eliminate) this particular type of collision. However, the system will not reduce the collisions resulting from other factors (e.g., poor sight distance, aggressive driving, and driver inattention).
- There are several operational situations that would not be detected by the proposed system. In typical urban roads with two lanes in each direction, there can be parked vehicles on the closest lane on the approach to the intersection. Beyond the intersection, there may be an access point (e.g. to a commercial area) that the bullet vehicles approaching from the left, may be heading to. In this situation, if the target vehicle is turning right, the assumption would be that the bullet vehicle will continue across the intersection on the far lane. However, it is likely the bullet vehicle will change lanes within or just after crossing the intersection and in such a case the system may have given the driver a ‘Proceed with Caution’ message erroneously. It is common for trucks turning right onto the minor road to slow down and cars on the far lane to be driving at regular (or faster) speeds. In such a case, the system may give an initial ‘Proceed with Caution’ message and then suddenly give a ‘Not safe’ message when the bullet vehicle is detected which may be too late. Although drivers are not supposed to change lanes at or near intersections, this situation requires the driver of the equipped vehicle to be diligent and proceed with caution.
- Another issue is the situation where a small vehicle (e.g. a motorcycle) may be hidden from the detection sensor by a large and long truck in the near lane during all time intervals used for detection. In the worst case, the hidden small vehicle would accelerate to gain a speed that is larger than the speed of the detected vehicle while it is still hidden from the detection sensors during all time intervals. This situation may be critical when the system concludes that the detected vehicle is not likely to collide with the departing target vehicle, while the speed and acceleration of the hidden vehicle are so large that it may collide with the departing target vehicle. The usual practice for most drivers is that they do not depart a controlled intersection if a large vehicle is approaching and they simply wait until that large vehicle passes. The proposed system, as well as all preceding systems, is not intended to address this problem as the detection sensors currently available in the market are not capable of detecting hidden vehicles.
4.0 Concluding Remarks
35 This paper has presented a technology-independent algorithm for a collision warning system for semi-controlled intersections. The system uses a pair of detectors (either radar sensors or laser scanners) to detect different vehicles traveling on the cross-traffic stream and determines their speeds and acceleration characteristics. Therefore, the algorithm can estimate the expected time required for the approaching vehicles to reach the intersection. The system also estimates the time required for the equipped vehicle to clear the intersection and by comparing the two times, the system displays a message for the driver of the equipped vehicle when it is safe to start departure. This will help reduce the human errors related to the driver of the equipped vehicle by avoiding the misjudgment related to perceiving the speeds and acceleration rates of the approaching vehicles. The time required for the equipped vehicle to depart the intersection depends on its intended path of departure and the time required for the driver to perceive the message received from the system and react to it. The departure time also depends on the driver’s desired rate of acceleration when departing the intersection. Based on this study the following comments are offered:
- The proposed in-vehicle collision warning system is initially set by inputting the age and gender of the driver of the equipped vehicle. Many previous research publications found that the PRT and driver acceleration rate are greatly affected by the age and gender of the driver. In particular, PRT increases with the age as older drivers usually have slower cognitive response than younger drivers (American Automobile Association, 1958; Lerner et al., 1995; Alexander et al., 2002). Also, previous research found that the PRT for female drivers is slightly longer than that for male drivers (Yan et al., 2007). As for the acceleration rate, it was also found that older drivers accelerate slower than younger drivers, which is apparently due to increased experience and reduced vision so that their driving behavior is less risky. However, this initial setup is only required at the beginning of implementing the system so that it can use the most appropriate estimate for PRT and acceleration rate in its calculations (based on the age and gender of the user). Once the system is implemented, it continually records the actual PRT and acceleration rate of the driver and uses those actual recorded values to predict future PRT and acceleration rate using the artificial neural network technique. The authors found that this technique can yield reasonable values for future PRT and acceleration rates using a database with approximately 300 records. This means that the initial regression models are only required a short initial period of system implementing beyond which the system can migrate to the more-sophisticated artificial neural network models that are based on the actual data collected. The system should also be able to identify different drivers in the vehicle by using an occupant classification system.
- The proposed system involves several assumptions. First, the driver of the equipped vehicle is assumed to always use the signal indicator when turning. This may not be reliable and is more probable during right turns than left turns. Furthermore, if there is a separate left or right turn lane, some drivers may not use their signals as they feel that it is understood they are turning left/right and no further intent needs to be communicated to other road users. Second, successful implementation of the proposed system would require that the intersections have adequate sight distances in order for the system to detect the approaching vehicles. Therefore, the proposed system should not be considered as an aid for the drivers in such situations. Some innovative research work on intersection sight distance has recently been developed (Easa et al., 2004; Easa and Ali, 2005). Third, the proposed algorithm is not designed for situations where an intersection collision results from the driver’s violation of traffic by-laws. An example is at a TWSC intersection where the driver of the equipped vehicle (on the minor road) attempts to enter the major road without fully stopping at the stop sign. In this case, the equipped vehicle might collide with another vehicle traveling on the major road as a result of driver’s aggressive behavior rather than from his/her misjudgment. Proper law enforcement measures would be more effective in addressing this type of collision.
- The research presented in this paper is technology-independent, which means that the scope of this paper is limited to the algorithm design for the proposed system. Further research is required to address other aspects of the system, such as signal design and building a prototype to be tested with actual vehicles prior to introducing the system as a commercial product. Further research is also required to evaluate the functionality of the radar/laser detectors under adverse weather conditions. This would require a multidisciplinary effort including electrical and mechanical engineering to select the radar/laser detector that meets the minimum specifications presented in the paper. However, previous research showed that most radar detectors used in vehicle technology that are suggested in this paper can function well under different unfavourable weather conditions.
- The proposed system is activated only when the equipped vehicle has a full stop, which can simply be detected by linking the system to its speedometer. A “full stop” situation is the typical practice at TWSC intersections as required by law. A slow or rolling stop is not considered in the algorithm so that the system is not considered as an aid for drivers who violate traffic law. However, future extension of the system may include its activation when the equipped vehicle’s speed fall below a certain threshold so that the system can also cover “yield” control intersections. In this case, the displacement of the equipped vehicle during the detection process can be measured from the vehicle odometer and that displacement can be used to adjust the calculations of the system algorithm. The disadvantage of this extension, however, is that it may encourage drivers to ‘roll’ stop at TWSC intersections instead of ‘full’ stop. Further research is required to address this point.
- The proposed system is mainly intended for passenger cars, which have mechanical characteristics that are not significantly affected by their load (American Association of Satte Highway and Transportation Officials, 2004; Transportation Association of Canada, 2007). Previous research (Drew, 1968; Long, 2000) found that the mechanical characterises for passenger cars can be adequately described by the maximum acceleration rate provided by the engine at the start of the movement, av, and the equilibrium (crawl) speed where the acceleration decreases to zero. However, those mechanical characteristics may be greatly affected if the departure path of the target vehicle is on a slope (especially uphill). In that case, the system may be deactivated once the vehicle’s suspension sensors detect unbalanced reactions between the front and rear tires that exceed a certain threshold. The system would then provide a proper message to the driver that the system is deactivated due to a large slope on the road. Another solution is by adjusting the calculated acceleration rate, and hence increasing the calculated departure time, based on the differential reactions read by the suspension sensors. Further research is required to fully investigate this solution.
Acknowledgement
This research is financially supported by a Discovery Grant from the Natural Sciences and Engineering Research Council of Canada (NSERC) and an NSERC Postgraduate Scholarship. The authors are grateful to two anonymous reviewers for their thorough and most helpful comments.References
Alexander, J., P. Barham, and I. Black, (2002). Factors influencing the probability of an incident at a junction: results from an interactive driving simulator. Accident Analysis and Prevention, 34 (6): 779–792.
American Association of State Highway and Transportation Officials (2004). A policy on geometric design of highways and streets. Washington, D.C.
American Automobile Association (1958). Reaction time as related to age. Research Report No.69. Washington, D.C.
Brown, T.L., J.D. Lee, and D. V, McGehee, (2000). Attention-based model of driver performance in rear-end collisions. Transportation Research Record 1724:14 – 20.
Dabbour, E. and S.M. Easa, (2009). Perceptual framework for a modern left-turn collision warning system. International Journal of Applied Science, Engineering and Technology.
Dravidam, U. and S. Tosunoglu, (2000). Driver behavioral factors in rear-end collision avoidance system. Florida Conference on Recent Advances in Robotics, Florida Atlantic University, Boca Raton, Florida, May 4–5.
Drew, D.R. (1968). Traffic flow theory and control., New York: McGraw-Hill USA. 5(1): 8-14.
Easa, S.M. and Z.A. Ali, (2005). Modified guidelines for left-turn lane geometry at intersections. Journal of. Transportation Engineering, ASCE, 131(9), 677-688.
Easa, S.M., E. Dabbour, and Z.A. Ali, (2004). Three-dimensional model for stop-control intersection sight distance. Journal of. Transportation Engineering, ASCE, 130(2), 261-270.
Fuerstenberg, K. Ch. and J. Chen, (2007). New European approach for intersection safety – results of the EC-Project INTERSAFE. Advanced Microsystems for Automotive Applications 2007.. Berlin: Springer-Verlag 61-74.
Grewal, M.S., and A.P. Andrews, (1993). Kalman Filtering Theory and Practice. New Jersey: Prentice Hall.
Harwood, D. W., J.M. Mason, R.E. Brydia, M.T. Pietrucha, and G.L. Gittings, G.L., (1996). Intersection sight distance. National Cooperative Highway Research Program Report 383.,Washington, D.C.: Transportation Research Board.
IBEO Automobile Sensor (2009). IBEO laser scanner LUX. www.ibeo-as.com. Accessed 24 January, 2010.
Kalman, R.E. (1960). A New Approach to linear filtering and prediction problems. Journal of Basic Engineering, 82 (1): 35 – 45.
Lerner, N. D., R.W. Huey, H.W. McGee, and A. Sullivan, A., (1995). Older driver perception-reaction time for intersection sight distance and object detection. Federal Highway Administration Report No. FHWA-RD-93-168.Washington, D.C.
Long, G. (2000). Acceleration characteristics of starting vehicles. Transportation Research Record 1737: 58-70.
Maybeck, P. (1979). Stochastic Models Estimation and Control.. New York: Academic Press.
Ministry of Transportation Ontario (2006). Ontario Road Safety Annual Report. Ministry of Transportation (MTO), Ontario, Canada.
NHTSA (2000). Automotive Collision Avoidance Systems (ACAS) Program. Final Report DOT HS 809 080. NHTSA, U.S. DOT, Washington, D.C., USA.
NHTSA (2004). Vehicle-based countermeasures for signal and stop sign violation. Progress Report DOT HS 809 716. NHTSA, U.S. DOT, Washington, D.C., USA.
Pierowicz, J., E. Jocoy, M. Lloyd, A. Bittner, and B. Pirson, B. (2000). Intersection collision avoidance using ITS countermeasures. Task 9: Final Report. National Highway Traffic Safety Administration Report No. DOT HS 809 171. Washington, D.C.
Smart Microwave Sensors SMS (2009). Smart Microwave Sensors. www.smartmicro.de. Accessed 25 January, 2010.
STISIM (2009). STISIM User’s Guide. Systems Technology Inc., Hawthorne, CA. www.systemstech.com. Accessed 25 January, 2010.
Taylor, S.J. (2005). Development of a Bayesian Decision Theory Framework to Enhance The Design of Rear-end Collision Warning Systems. Unpublished doctoral dissertation, Carleton University, Ontario, Canada.
Transportation Association of Canada (2007). Geometric design guide for Canadian roads. Transportation Association of Canada, Ottawa, ON, Canada.
Transport Canada (2003). Road Safety in Canada – 2003. TP 13951 E, Ottawa, Canada.
U.S. Department of Transportation (2003). Intersection Collision Avoidance Study. Final report published by Department of Transportation (DOT) and Federal Highway Administration (FHWA) Safety Office. Washington, D.C., USA. www.itsdocs.fhwa.dot.gov//JPODOCS/REPTSTE//14105.htm Accessed 25 January, 2010.
VORAD (2009). VORAD Collision Warning System. Eaton Corporation, Cleveland, Ohio, USA. www.vorad.com. Accessed 25 January, 2010.
Watamaniuk, S.N.J. and A. Duchon,(1992). The human visual system averages speed information. Vision Research, 32(5):. 931 – 941.
Yan, X., E. Radwan, and D. Guo, (2007). Effects of major-road vehicle speed and driver age and gender on left-turn gap acceptance. Accident Analysis and Prevention, 39(5): 843-852.