Articles
Signalized Intersection Capacity Adjustment Factors for Makkah, Saudi Arabia
Abstract
Operation and performance of a signalized intersections relies on the roadway’s environmental features and users’ behavioral characteristics which significantly differ among locations. Although the Highway Capacity Manual (HCM) provides general guide for designing traffic elements, its recommendations regarding particular values of design parameters may not be universally applicable. This paper analyses saturation flow rate and capacity adjustment factors for signalized intersection in Makkah, Saudi Arabia. Results of the research reveal that the capacity of signalized intersection in Makkah is 2500 passenger cars per hour of green time per lane which is significantly higher than the value prescribed in HCM. Capacity adjustments factors also vary from HCM recommendations. Moreover, research outputs might be utilized for formulating a Highway Capacity Manual for the country and estimated parameters may be useful in signal design and traffic system performance analysis in Saudi Arabia.
1.0 Introduction
1 At-grade intersection is one of the most critical elements that influence the performance of urban traffic network. For safe and efficient movement of large volumes of traffic, intersections are usually signalized. The design and operations of a signalized intersection rely critically on its capacity. The Highway Capacity Manual (Transportation Research Board, 2000), Canadian Capacity Guide (Telph, 1995) and the Australian Road Research Board's (ARRB) Special Report on Traffic Capacity and Timing Analysis (Akcelik, 1981) provide general guidelines concerning operational characteristics and estimating the capacity of a signalized intersection. Teply and Jones (1991) and Khosla (2006) summarize the concepts and compare the measurement techniques used by agencies and researchers in different countries. In general, the capacity of a signalized intersection relies on the Saturation Flow Rate (SFR) in ideal condition and adjustment factors to accommodate prevailing geometric and traffic conditions. Although manuals specify values for these parameters, researchers have observed significant fluctuation in these values among different locations due to variations in behavioral and environmental characteristics (Bester and Meyers, 2007; Bonneson et al., 2005; Liu et al., 2005; Turner and Hatahap, 1993 and Zegeer 1986).
2 During the last few years Saudi Arabia has experienced very rapid growth in traffic volume and substantial investment in the expansion of the road network failed to cope with increasing traffic congestion in most of its cities. Recently the government has initiated an extensive redevelopment plan for land use and road networks in urban areas including Makkah. For the efficient design and operation of a road network in the city traffic flow parameters, including intersection capacity and corresponding adjustment factors, should be reassessed on the basis of local traffic characteristics. To predict the capacity of signalized intersections in Saudi Arabia, this research focuses on the determination of capacity adjustment factors for U-turn, heavy vehicles, number of lanes and lane width, based on headway distribution in local conditions. In addition, this paper analyses the saturation flow rate for approaches at signalized intersections in Makkah.
3 Following a brief review of literature in Section 2.0, the data used for analysis are described in the next section. The research methodology adopted in the paper and analytical results are presented subsequently followed by key conclusions and major findings.
2.0 Review of the Literature
4 The Highway Capacity Manual (HCM) defines saturation flow rate as "the equivalent hourly rate at which previously queued vehicles can traverse an intersection approach under prevailing conditions, assuming that a green signal is available at all times and no lost time is experienced." It suggests an ideal saturation flow rate of 1900 passenger cars per hour of green time per lane (pcphpl). Adjustment factors are applied to address the impacts of prevailing (local traffic) conditions that deviate from ideal conditions relating to roadway geometry (e.g. lane width, lateral clearance, number of lanes, grades), vehicle composition and proportion of turning movements (Highway Capacity Manual, 2000).
5 HCM recommends measurement of saturation flow rate for each lane based on observed headways as vehicles pass over the stop line of the intersection approach. It observes that for most cases the first four headways include lost time. For measuring saturation headway it proposes to commence with the fifth headway in the queue and end when the front wheels of the last vehicle in the standing queue crosses the stop line. The saturation flow rate is calculated as the reciprocal of the mean saturation headway. The discharge headway method is also widely used for estimating saturation flow rate at signalized intersections. Previous studies indicated that discharge headway would converge to saturation headway after the fourth to sixth discharged passenger car crossing the stop line since the beginning of the green light (Roess et al., 2004).
6 While assessing the capacity of a signalized intersection the next step involves determination of adjustment factors for deviation from ideal geometric and traffic conditions. Geometric factors include lane width, gradient, number of lanes, etc. while traffic factors account for vehicle composition, movement type and traffic environment. HCM treats U-turns as left-turns for estimating effective saturation flow rate. Adams and Hummer (1993) did not find any correlation between saturation flow and the percentage of U-turns for intersections where U-turn volume is less than 50 percent of left turning traffic. However, their analysis was statistically inconclusive for 50-65 per cent of U-turning vehicles because of small sample size. They recommended tentative reduction factors of 0.9 for U-turn percentages between 65 and 85, and 0.8 for U-turn percentages exceeding 85. These results have been criticized for small sample size and measurement error in saturation flow rate. Tsao and Chu (1996) investigated the effects of U-turns on saturation flow rate in left-turn lanes and suggested that average headways of U-turning passenger cars are significantly larger than those of left turning passenger cars. They found that the effects of U-turning vehicles depend upon the percentage of U-turning vehicles in the left-turn lane and the order of the queue formation in the traffic stream. When preceded by left-turning vehicle, average headway of a U-turning passenger car is 1.27 times that of a left-turning passenger car. However, when preceded by U-turning vehicle the average headway of U-turning passenger cars is 2.17 times that of left-turning passenger cars. Liu et al. (2005) analyzed the effects of U-turning vehicles on the left-turn saturation flow rate at signalized intersections in Florida and recommended capacity reduction due to U-turning vehicles when the percentage of U-turning vehicles was relatively high (more than 40%). In addition, they concluded that U-turning vehicles adversely affect the capacity of signalized intersections and the effect increases with the increasing percentage of U-turning vehicles in left-turn lane. Carter et al. (2005) studied operational and safety effects of U-turns at signalized intersections. Their results, based on regression analysis, suggest that the saturation flow rate in the left-turn lane reduces by 1.8 per cent for a 10 per cent increase in U-turn volume and an additional 1.5 per cent capacity loss is observed when U-turn movement is opposed by protected right-turn overlap from the cross streets. He et al. (2005) observed U-turn discharge headway and capacity, and suggested that U-turn discharge headways follow a log-normal distribution. Average saturation headways of 2.91, 2.15, and 2.23 seconds were recommended for U-turn, through and left-turn respectively. They further noted that turning radius and gender demonstrated insignificant impact on U-turn saturation headway.
7 Tsao and Chu (1995) suggests that the effect of heavy vehicles on headway is more prominent in left turn lanes than through lanes. Lewis and Benekohal (2007) recommend a 30 per cent reduction in capacity if heavy vehicles make up 40 per cent of the traffic stream which is substantially less than the value recommended by HCM. Le et al. (2000) investigated the effect of the number of lanes on capacity and observed that saturation flow rate increased by about 4.3 per cent in three-lane as compared to two-lane through movement approaches. Bester and Meyers (2007) observed saturation flow rate to increase by 25 per cent for each additional through lane. They recommended a base saturation flow rate of 2246 pcphpl which is much higher than the HCM recommendation.
8 For lane width, the HCM recommends 3.66m in the ideal case and a reduction of capacity for reduced width. Agent and Crabtree (1983) indicated that lane width might not have any effect on saturation flow for widths more than 3.0m and suggested a 5 per cent reduction in saturation flow for lane widths between 2.7 and 3.0 m. For commercial vehicles no effect was observed even for lane widths below 3.0m. Zegeer (1986) evaluated saturation flow rates on approaches with lane widths varying between 2.6 and 4.7m, and found that saturation flow rate reduces by 2 to 5 per cent for narrower lanes and increases by 5 per cent for wider lanes as compared to standard ones. Potts et al. (2007) investigated the relationship between lane width and saturation flow rate on urban and suburban signalized intersections and observed that saturation flow rate varied significantly with lane width. Average saturation flow rate ranged between 1,736 to 1,752 pcphpl for 2.9m lanes, 1,815 to 1,830 pcphl for 3.3 to 3.6m lanes, and 1,898 to 1,913 pcphpl for lane widths of 4.0m or greater. These saturation flow rates are generally lower than those currently recommended by the HCM. Lewis and Benekohal (2007) suggested that adjustment factors vary from 0.82 to 1.13 for lane widths ranging between 2.8 and 4.0 meters.
9 The need for estimating traffic parameters considering local traits has been recognized widely in the literature. However, investigation of these factors is analytically intricate and challenging due to the complexities of their interactions. This paper analyses saturation flow rate and adjustment factors at signalized intersections in Makkah, Saudi Arabia to facilitate improved design and operational management. Furthermore, movement patterns are examined and headway distributions are analyzed to predict the capacity of signalized intersections in the city.
3.0 Data Collection
10 Five signalized intersections in Makkah were selected for this study. Traffic operation at the study sites was recorded using a video camera and speed, volume and headway data were then transcribed using Ulead software. Study sites were selected based on a range of criteria to satisfy the study requirements which included level terrain; exclusive left-turn lanes with a protected signal phase; no pedestrian crossing, parking nor bus-stops; and having significant U-turn and left-turn vehicles. For measuring time to estimate speed and headway, Ulead facilitates a precision of 0.034 seconds (30 frames per second) which is satisfactory for the analysis. Data were collected for time periods which reflect typical peak traffic periods at each study site during weekdays.
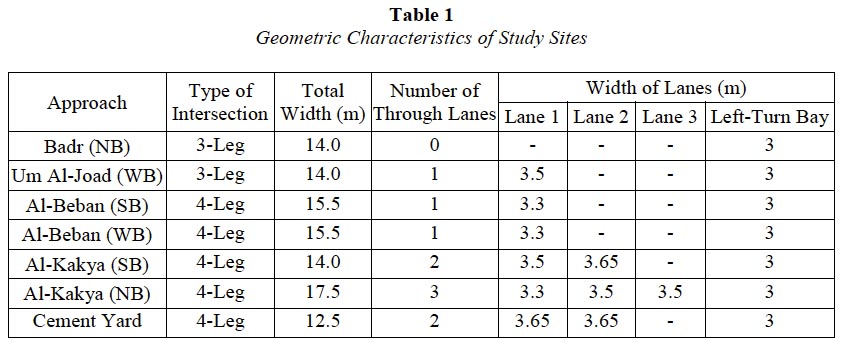
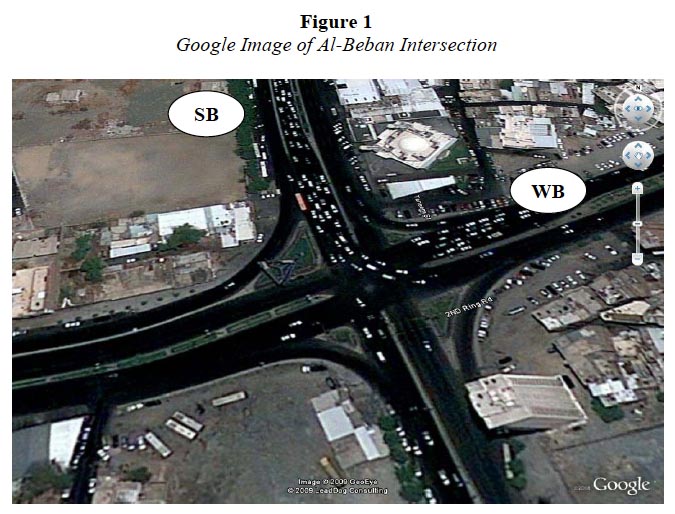
11 Among the five intersections selected for the study, two are three-leg intersections (Badr and Um Al-Joad), while the rest are four-leg intersection (Al-Beban, Al-Kakya, and Cement Yard). The geometric characteristics of the intersections are summarized in Table 1 and Figure 1 shows the layout of the Al-Beban intersection which is typical of those in the study. The average cycle length of all five selected intersections is 95 seconds while the average green interval in major approaches of the different intersections is 35 seconds. The maximum green interval is 50 seconds observed at the west-bound approach of Um Al-Joad intersection and the maximum cycle length is 155 seconds at the Al-Beban intersection.
12 As vehicles in the queue begin crossing the reference line at a signalized intersection after the signal becomes green, the time elapsed between successive vehicles provides the corresponding discharge headway which determines the capacity and adjustment factors for different types of movements.
13 From video images headway information was transcribed in accordance with the HCM standard procedure (Highway Capacity Manual, 2000). In the case of saturation flow analysis, observed headways were plotted for each cycle. Saturation headway was estimated from the average of the uniform headways which generally occurred after the fourth or fifth vehicle in the queue. For adjustment factors, headway data for each type of movement was transcribed and analyzed using the equations described below.
4.0 Saturation Flow Rate Measurement
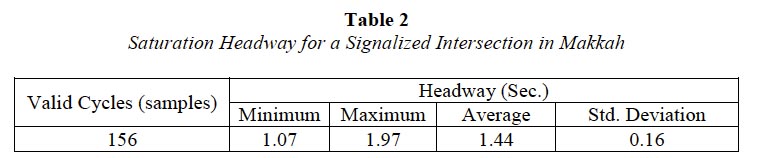
14 The basic saturation flow rate was measured for through lanes during cycles containing only passenger cars and satisfying the criteria for ideal conditions. It was estimated on the basis of measured average headways using Equation (1) and estimated average headway, based on 156 cycles in different through lanes, is shown in Table 2. Saturation Flow Rate in ideal conditions was found to be 2500 pcphpl which is significantly higher than 1900 pcphpl suggested in HCM (Highway Capacity Manual, 2000).

14 where S is the saturation flow rate, h is saturation headway, l is the last queued vehicle position, h jis headway of the j th queued vehicle and n is the position of the queued vehicle from the beginning of saturation flow region.
5.0 Capacity Adjustment Factors
5.1 Adjustment Factor for U-Turn
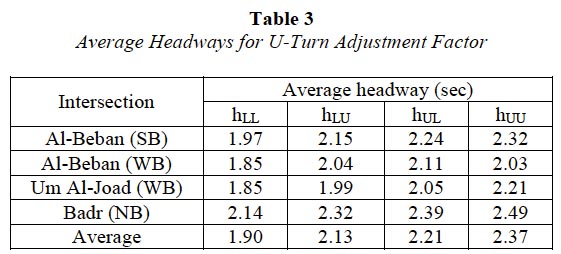
15 Based on 234 cycles, headway data for 1589 vehicle pairs of in the left-turn lanes were analyzed for assessment of the U-turn adjustment factor. The average percentage of U-turn vehicles at Al-Beban (SB, WB), Um Al-Joad, and Badr intersection approaches were 35.5, 25.8, 24.9, and 63.9 per cent respectively. Table 3 summarizes the measured average headways in four categories namely, left-turn preceded by left-turn (h LL), left-turn preceded by U-turn (h LU), U-turn preceded by left-turn (h UL) and, left-turn preceded by U-turn (h LU). Salient features of the observed data are summarized below:
- Headway of left-turning vehicle increases significantly when preceded by U-tuning vehicle.
- Maximum headway is observed for U-turns preceded by another U-turning vehicle.
- Effects of U-turns on saturation flow rates increases with the percentage of U-turning vehicles.
16 Saturation flow rates in left-turn lanes depend on the proportion of U-turns in the lane and the order of traffic stream formation for types of movements by preceding and following vehicles. The upper limit of adjustment factors is observed for minimum average headway, which occurs when there are no successive U-turns. Conversely, the lower limit of the adjustment factors occurs when headway reaches the maximum value for a particular proportion of U-turning vehicles. By substituting measured headways from Table 3 into Equations (2)-(7), the upper and lower limits of adjustment factors for U-turns are calculated as summarized in Table 4.


16 where:
- h max(a) and h min(a) are maximum and minimum average headway respectively.
- S L is saturation flow rate of all left-turning vehicles (pcphpl).
- S max(a) and S min(a) are maximum and minimum saturation flow rate respectively.
- f max(a) and f max(a) are maximum and minimum adjustment factors respectively. ‘a’ is the percent of U-turning vehicles (pcphpl).

5.2 Adjustment Factor for Heavy Vehicles
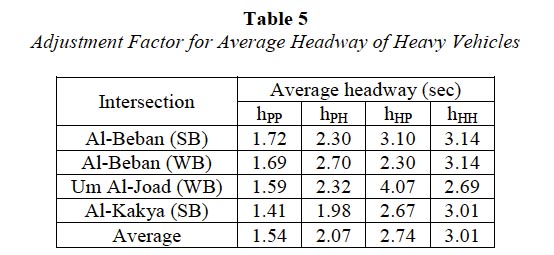
17 Vehicles having more than four wheels or two axles are considered to be heavy vehicles in this study. The average length of heavy vehicles ranges between 12.5 and 18m, and the average height and width of these vehicles are 4.2m and 2.6m respectively. A capacity adjustment factor for heavy vehicles was assessed on the basis of recorded data for 327 cycles and 1639 vehicle pairs. Measured headways at different intersections are summarized in Table 5.
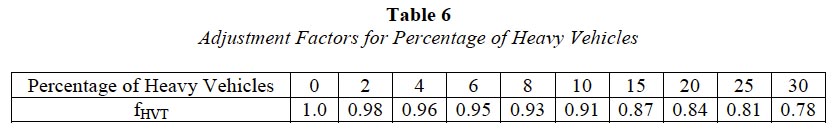
18 Saturation flow rates in traffic lanes exclusively used by passenger cars or heavy vehicles can be derived from their respective average headway. Under mixed-traffic conditions, however, the average headway is expressed as function of the percentage of heavy vehicles as shown in equation (8). Adjustment factors for heavy vehicles in through lanes can be estimated using equation (9) as shown below. The estimated average value of the heavy vehicle adjustment factor for different percentages of heavy vehicles is shown in Table 6.


18 where h a is average headway under mixed traffic conditions (sec); a is the proportion of heavy vehicles (%); S aT and S PT are saturation flow rates in a through lane for mixed and exclusive passenger car traffic respectively (pcphpl); h aT and h PT are average headway in a through lane for mixed and exclusive passenger car traffic respectively (sec).
5.3 Adjustment Factor for Number of Lanes
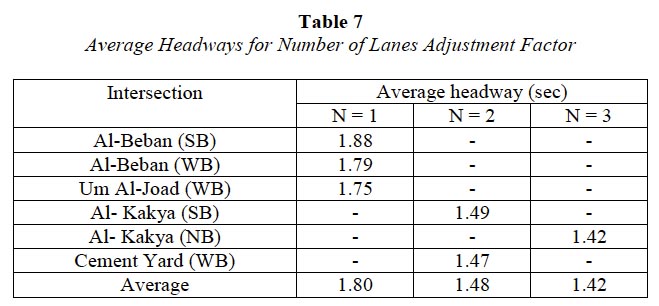
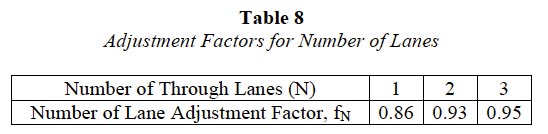
19 Estimation of number of lanes adjustment factor was based on 564 valid cycles for different numbers of lanes at the study sites. A valid cycle contained at least eight queued passenger cars. Any cycle which contained heavy vehicles or turning movement was excluded from consideration. Headway and adjustment factors were estimated using 125, 223 and 216 cycles for one, two and three through-lanes respectively. Average headways and adjustment factors, as estimated using equation (10), are presented in Tables 7 and 8 respectively.

19 where N is the number of through lanes and E CL is the curb-lane equivalency factor (average curb-lane headway divided by headway in a non-curb through lane).
5.4 Adjustment Factor for Lane Width
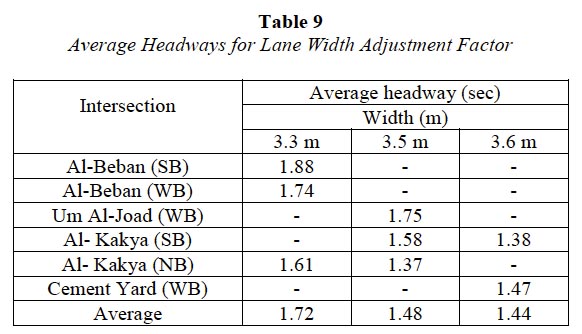
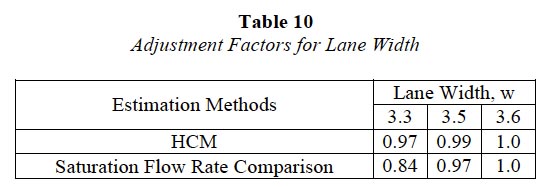
20 Estimation of a lane width adjustment factor was based on 560 cycles for different lane widths. According to the HCM the adjustment factor related to lane width may be estimated using equation (11) which ignores headway information. More rational appraisal of the factor may be obtained by comparing saturation flow rates calculated on the basis of average headway for different lane widths as shown in Equation (12). Estimated values of headway and adjustment factor for lane width are presented in Tables 9 and 10 respectively.


20 where w is lane width (m), S w is the saturation flow rate for lane width w and S 3.6 is the saturation flow rate for lane width of 3.6m.
6.0 Discussion
21 This paper focuses primarily on the estimation of saturation flow rate and adjustment factors for signalized intersections in Makkah. Results show that the ideal saturation flow rate in Makkah is 2500 pcphpl. Although the value is about 30 percent higher than that recommended in the Highway Capacity Manual (2000), it is consistent with observations in countries with a similar traffic environment. For example, Bester and Mayers (2007) reported a saturation flow rate of more than 2500 pcphpl in South Africa. Furthermore, studies on the transferability of HCM rates to Asian countries showed that the HCM rates substantially underestimate roadway capacities applicable in those regions. Besides the general observation of aggressive driving behavior in Saudi Arabia, as demonstrated by ubiquitous tail-gating and rapid acceleration patterns, higher values of saturation flow rate in Saudi Arabia might result from prolonged heavily congested situations and a capacity bubble factor (Zunhwan et al., 2005). Further research is necessary to measure the marginal effects of these factors on capacity.
22 U-turn adjustment factors found in the study are consistent with those suggested for North America (Liu et al., 2005 and Carter et al., 2005), but higher than the values recommended for Taiwan (Tsao and Chu, 1996). The heavy vehicle adjustment factor was found to be similar to that found in other studies and results suggest that roadway capacity reduces rapidly with an increase in the numbers of heavy vehicles in the traffic composition. The effects of numbers of lanes and lane width were found to be higher in Makkah than in other cities (Tsao and Chu, 1996; Liu et al., 2005 and Lewis and Benekohal, 2007). Results suggest that the road network in Makkah should be designed for more than three lanes having lane width exceeding 3.5m for efficient utilization of road space.
23 Outputs of the study may be applied to the design and operation of road networks and traffic signals in urban areas in Saudi Arabia. Moreover, it will also help in characterizing driving behavior and devising strategies to improve the efficiency and safety of traffic system.
7.0 Conclusion
24 This paper analyses saturation flow rate and adjustment factors for signalized intersections in Makkah, Saudi Arabia. The saturation flow rate for ideal conditions in Makkah is 2500 pcphpl which is significantly higher than the value recommended by the HCM (2000). Analysis reveals that the adjustment factor for U-turns in the left-turn lane reduces with an increasing proportion of turning vehicles. It also suggests that heavy vehicles affect intersection capacity very severely and capacity reduces by 22 per cent for 30 per cent heavy vehicles in the traffic stream. Capacity also falls sharply for a reduction in the number of lanes and lane width. Output from this study is expected to assist in signal design and formulation of a Highway Capacity Manual for Saudi Arabia. Findings of the study demonstrate that the design parameters of the traffic system may vary significantly depending on the local characteristics. For traffic safety and efficiency these parameters should be assessed using local data. The research reported in this paper should be extended to incorporate other adjustment factors, and the effects of geometric, behavioral and environmental factors relating to local traffic condition should also be analyzed.